The Inflammatory Skin Disease Map (ISD) pages
Technical information
Development status: Available for exploration online
Online access and exploration: https://imi-biomap.elixir-luxembourg.org
Disease IDs | Psoriasis: DOID:8893, MESH:D011565, MONDO:0005083
Disease IDs | Atopic dermatitis: DOID:3310, MESH:D003876, MONDO:0004980
Sustainable support: LCSB, MINERVA Platform
Construction tool: CellDesigner
Funding: IMI2 BIOMAP No 821511, BIOMAP
License: Creative Commons Attribution 4.0 International (CC BY 4.0) License
Publication: PubMed
Contact: Marcio Luis Acencio marcio.acencio@gmail.com, Oxana Lopata oxana.lopata@uni.lu and Marek Ostaszewski marek.ostaszewski@uni.lu, University of Luxembourg
Brief introduction
The ISD map is a network of atopic dermatitis (AD)- and psoriasis (PsO)-specific molecular interactions represented as computable diagrams. It is available as a set of interactive diagrams, similar to canonical pathway databases, but focused on AD and PsO mechanisms. The ISD map can be used for data interpretation, hypothesis generation and simulation modelling.
| Access the map | Learn how to navigate and explore the map |
| Open in MINERVA | Quick User Guide |
Structure of the ISD map
The map is comprised by three layers: a side-by-side layer that is the entry point for the ISD map and contains the key molecules and cells associated with AD and PsO, the intercellular communication views depicting how AD and PsO-relevant cell types interact, and the intracellular pathways layer illustrating signalling networks within some selected cells.
AD map
| Intercellular communication layer | Intracellular pathways layer |
|---|---|
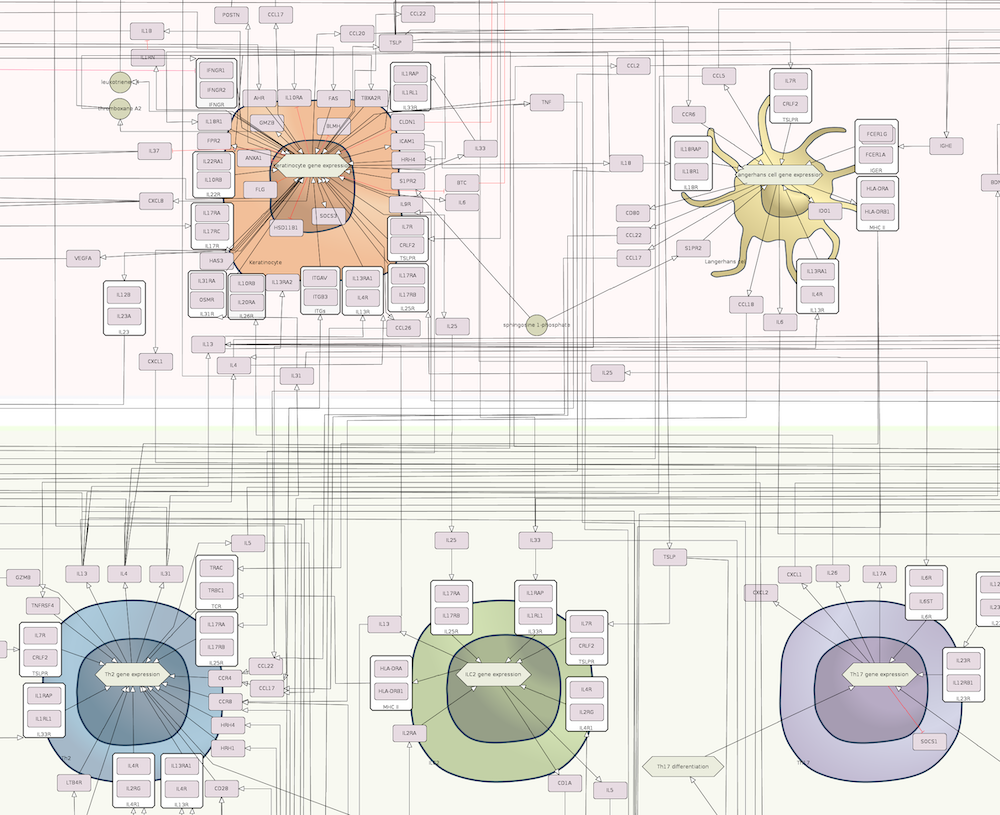 |
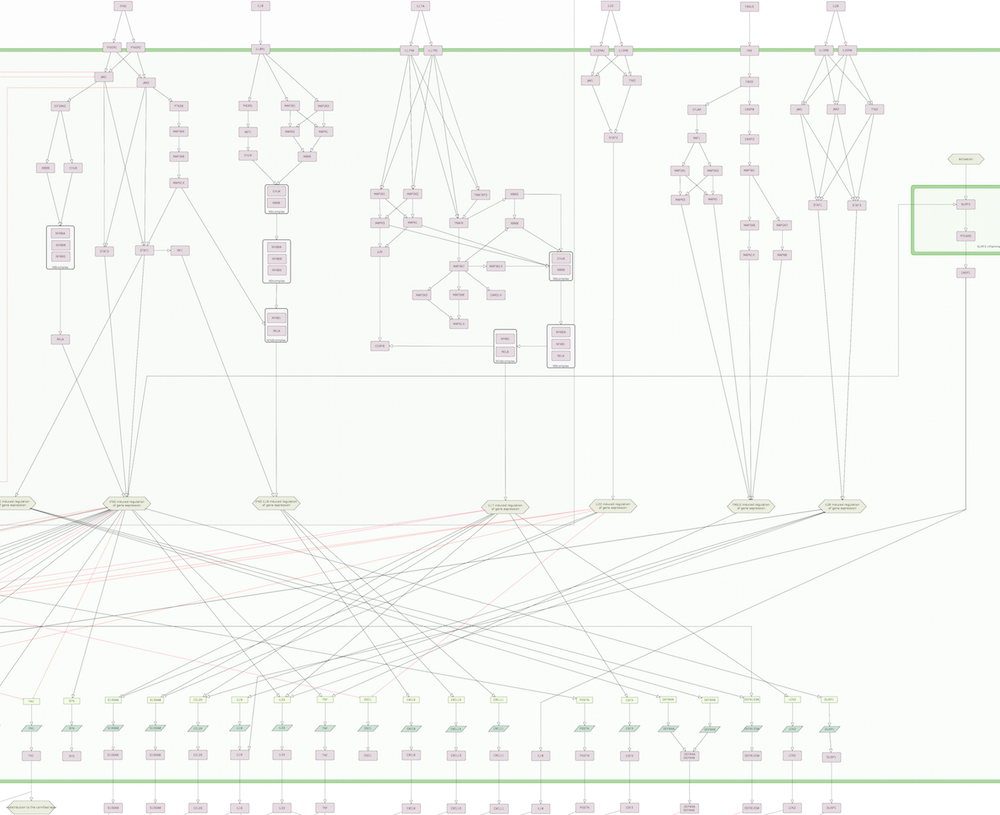 |
PsO map
| Intercellular communication layer | Intracellular pathways layer |
|---|---|
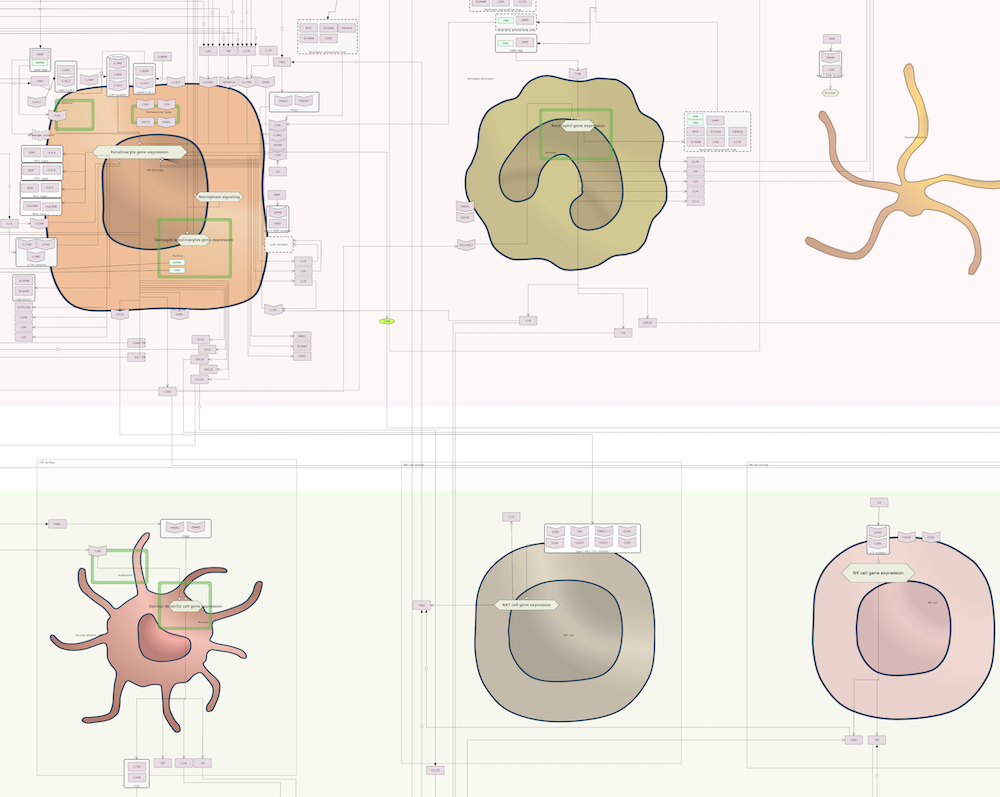 |
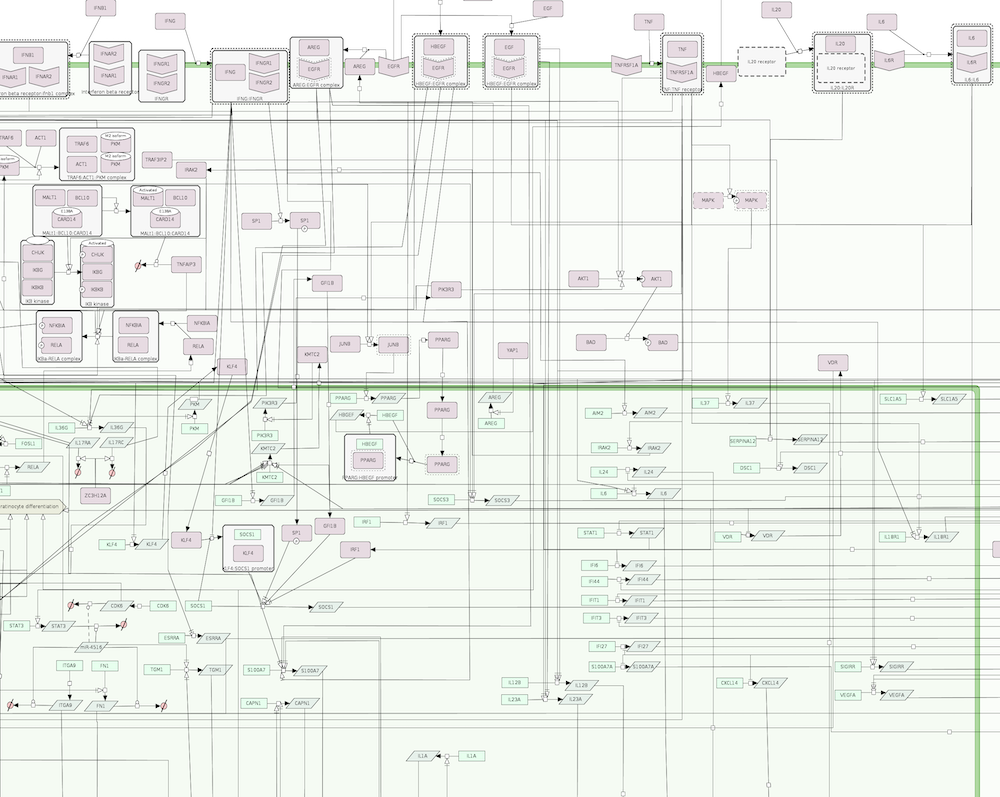 |
Applications of the ISD map
To demonstrate how the map can be used, we offer here some applications along with a step-by-step guide to reproduce the analysis.
- Analysis of the network structure (AD map example)
- Integration of genetic variation data into the map (AD map example)
- Integration of genetic variation data into the map (PsO map example)
- Integration of transcriptomics and proteomics data into the map (AD map example )
- Boolean simulations of part of the AD map (the IL4/IL13 pathway) (Coming soon!)
Supplementary information
- The biology embedded in the map (Brief description of AD- and PsO-related molecular mechanisms present in the map)
- How was the map constructed? (Description of procedures and tools used to build the map)
Acknowledgements
|
|
This project is supported by ELIXIR Luxembourg (ELIXIR-LU) Node. ELIXIR-LU hosts and maintains the MINERVA Platform for this project and supports its development. |