Step-by-step guide to reproduce the application “SNPs in upstream IFNG regulators in Th1 cells favor upregulation of IFNG and drive resistance to dupilumab”
1. Obtaining the genetic variant data
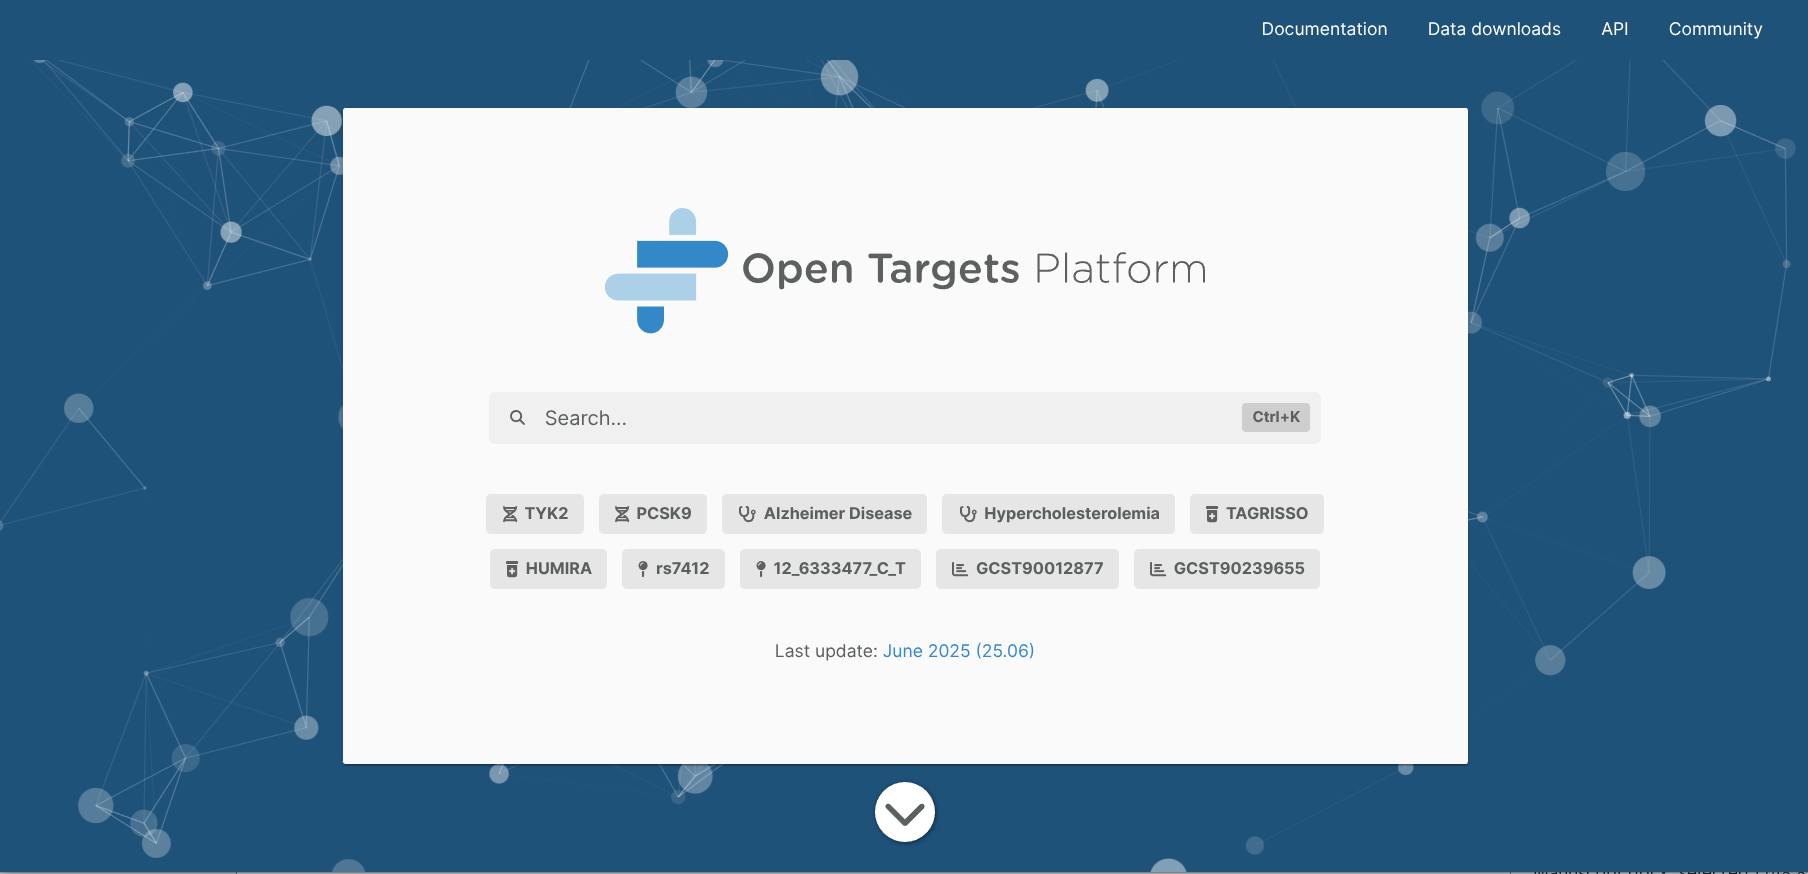
1.1. Collect genes harbouring variants (SNPs) associated with AD from the Open Targets database. First, access the Open Targets Platform’s home page.
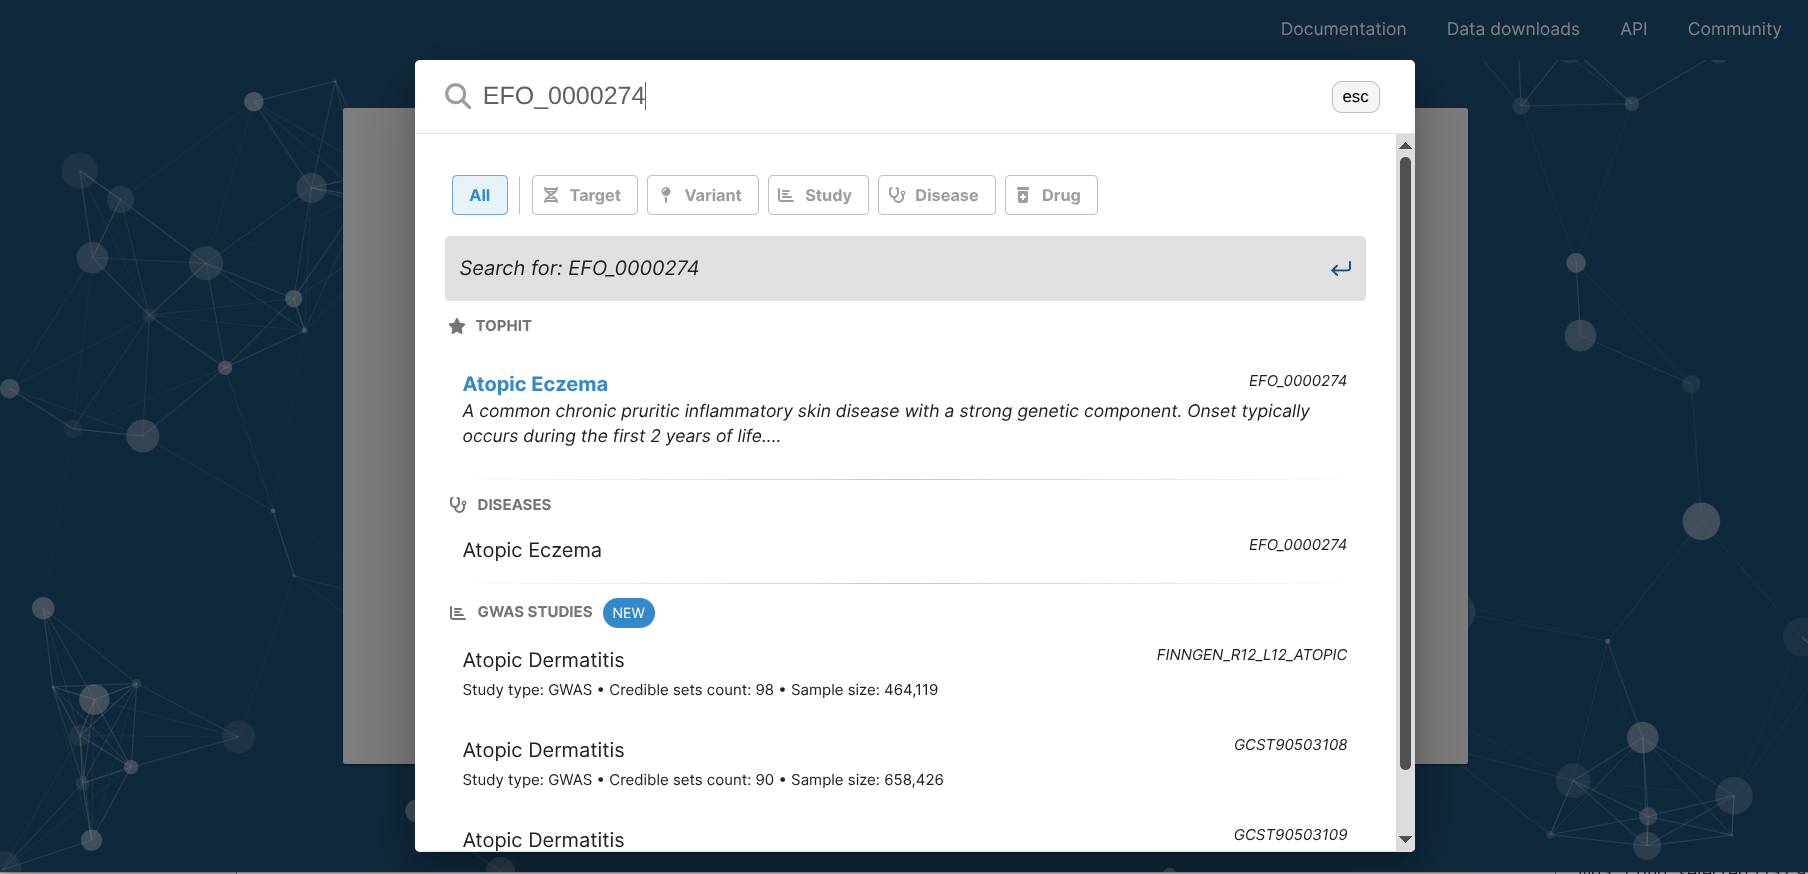
1.2. Then, use the Experimental Factor Ontology (EFO) identifier of AD (EFO_0000274) as query. As soon as you finish typing, “Atopic eczema” appears in the screen. Click it.
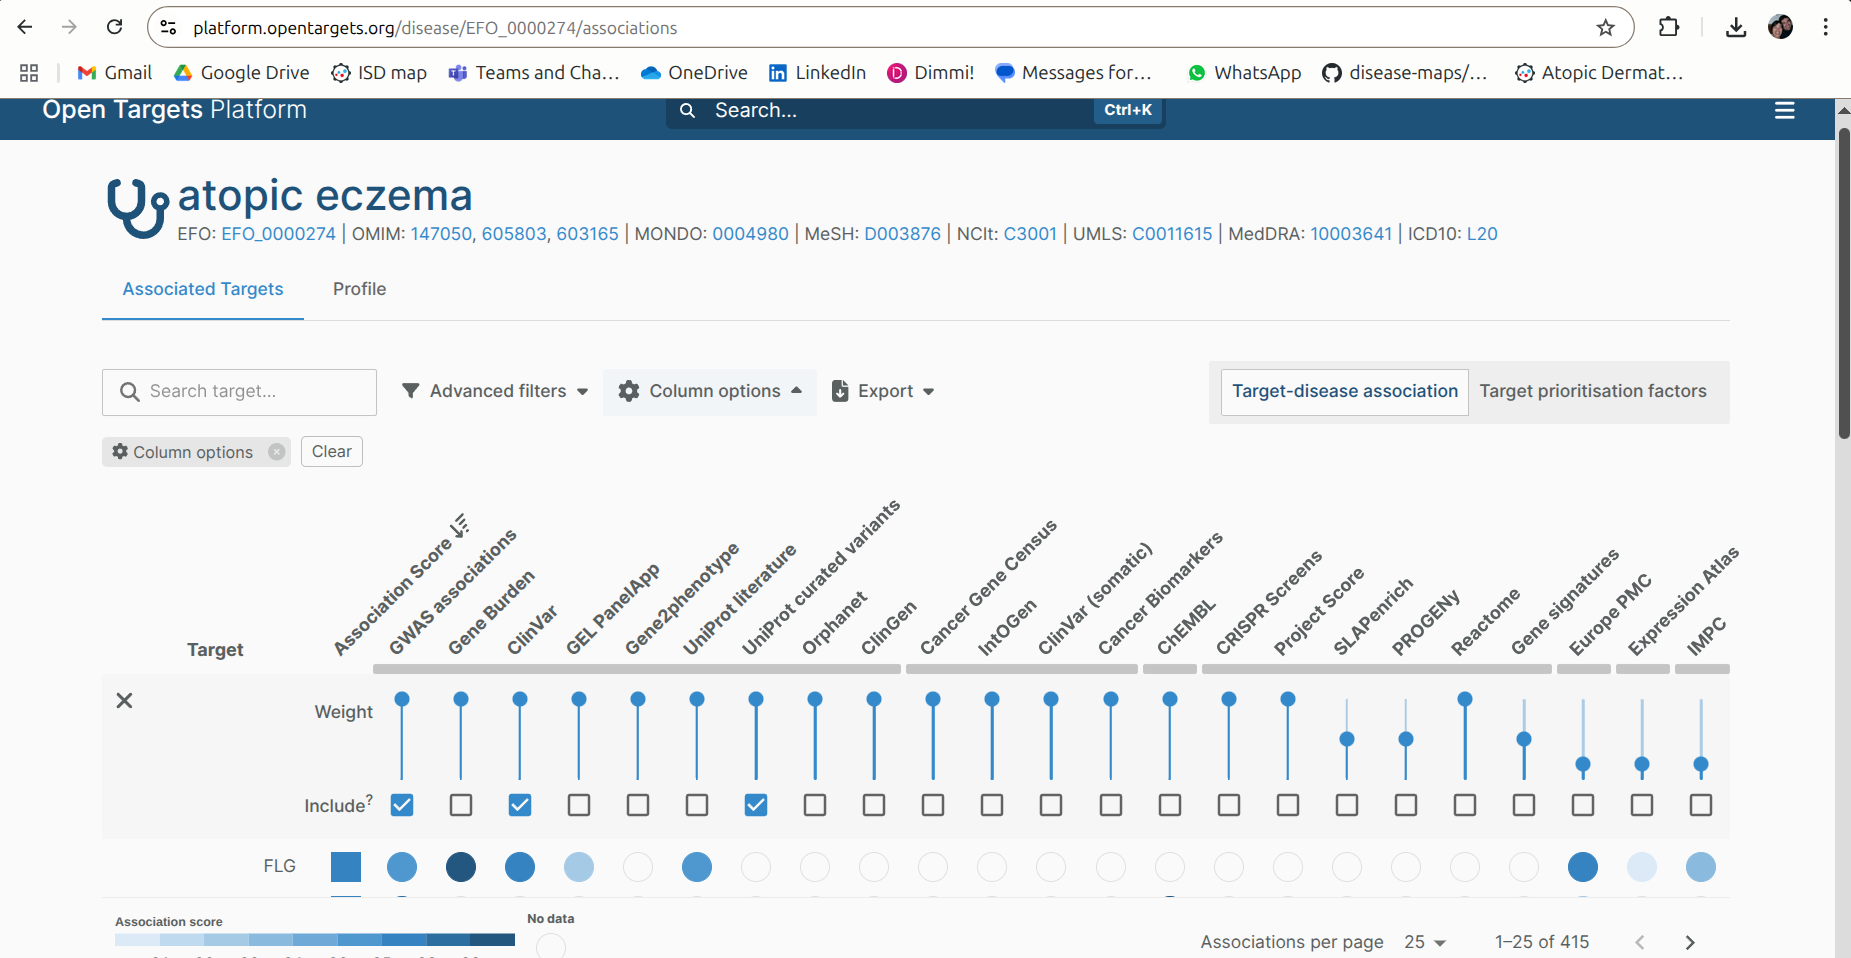
1.3. A page containing the retrieved results appears. Go to “Columns options” and selected the following sources of genetic data: GWAS associations, ClinVar and Uniprot Curated Variants
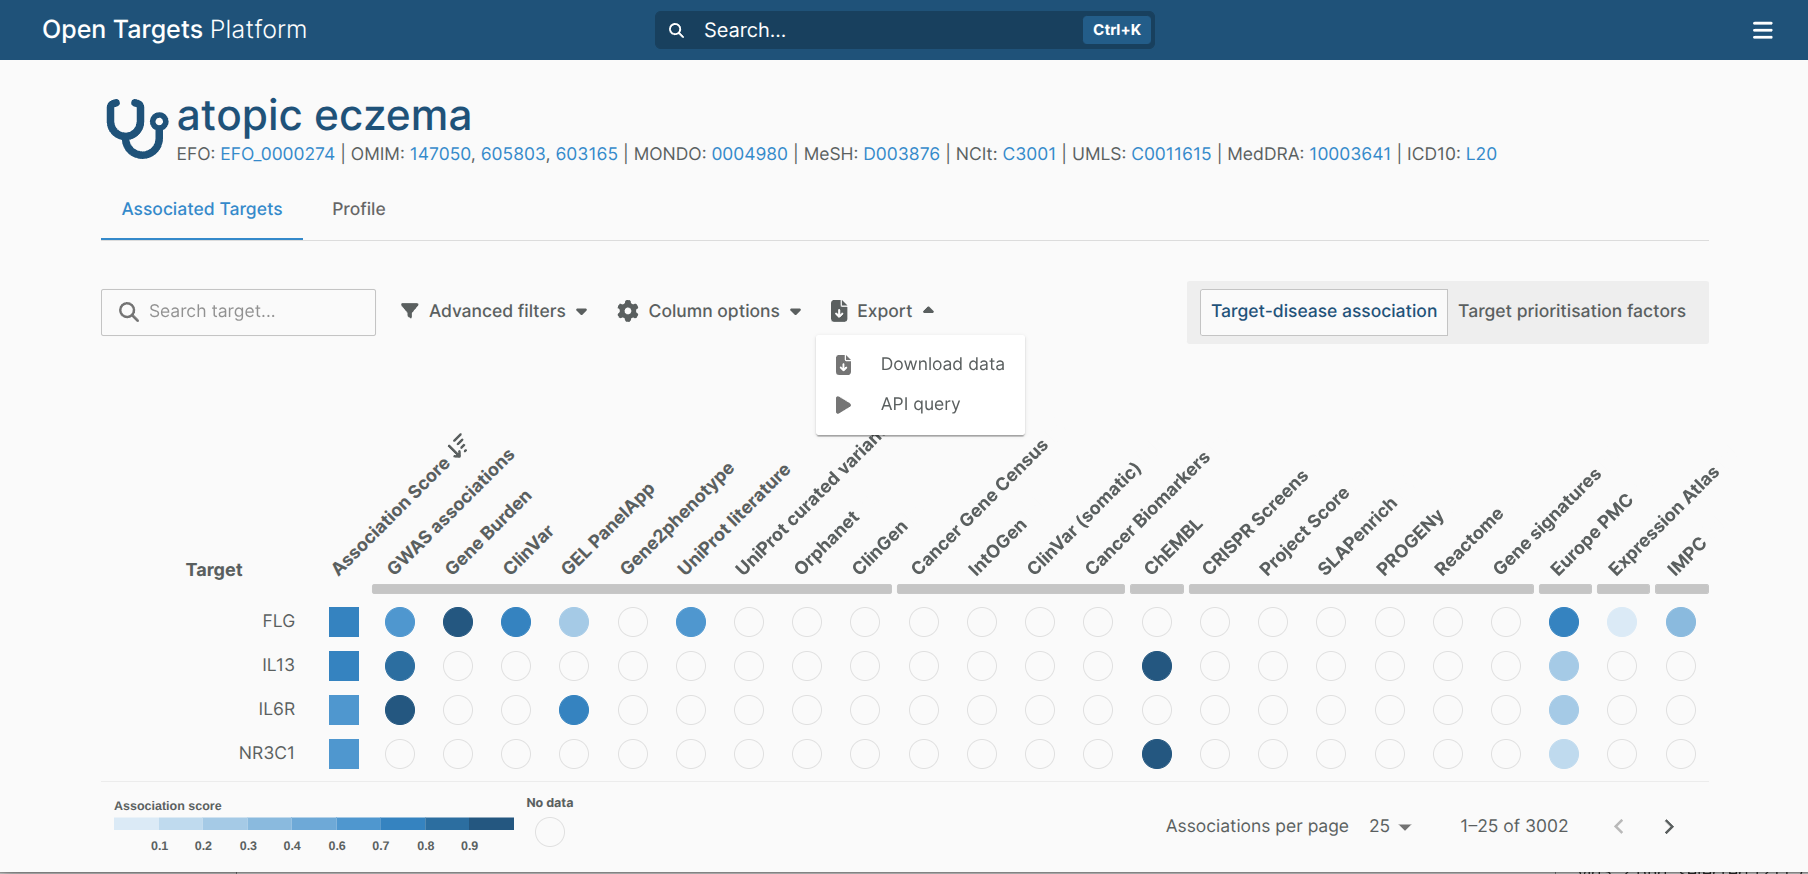
1.4. Click “Export” and then “Download data”
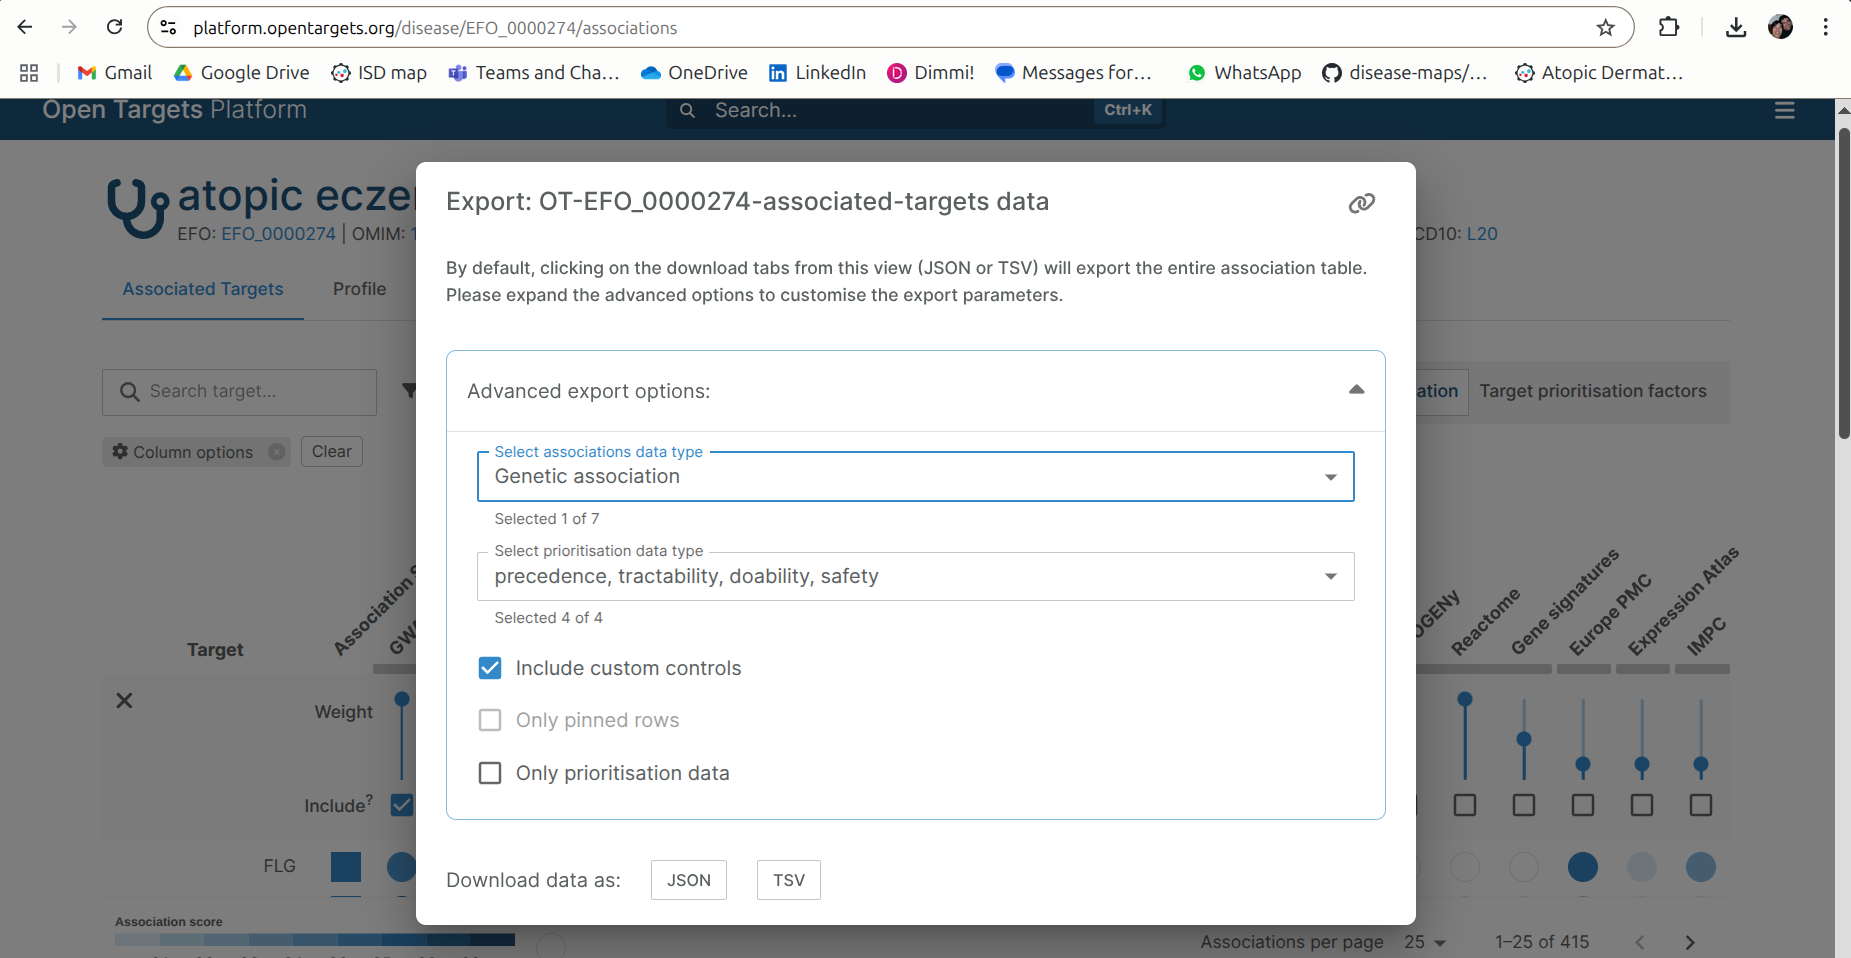
1.5. A new windows appears. Click “Advance Expert Options” and, in the field “Select association data type”, select only “Genetic association”
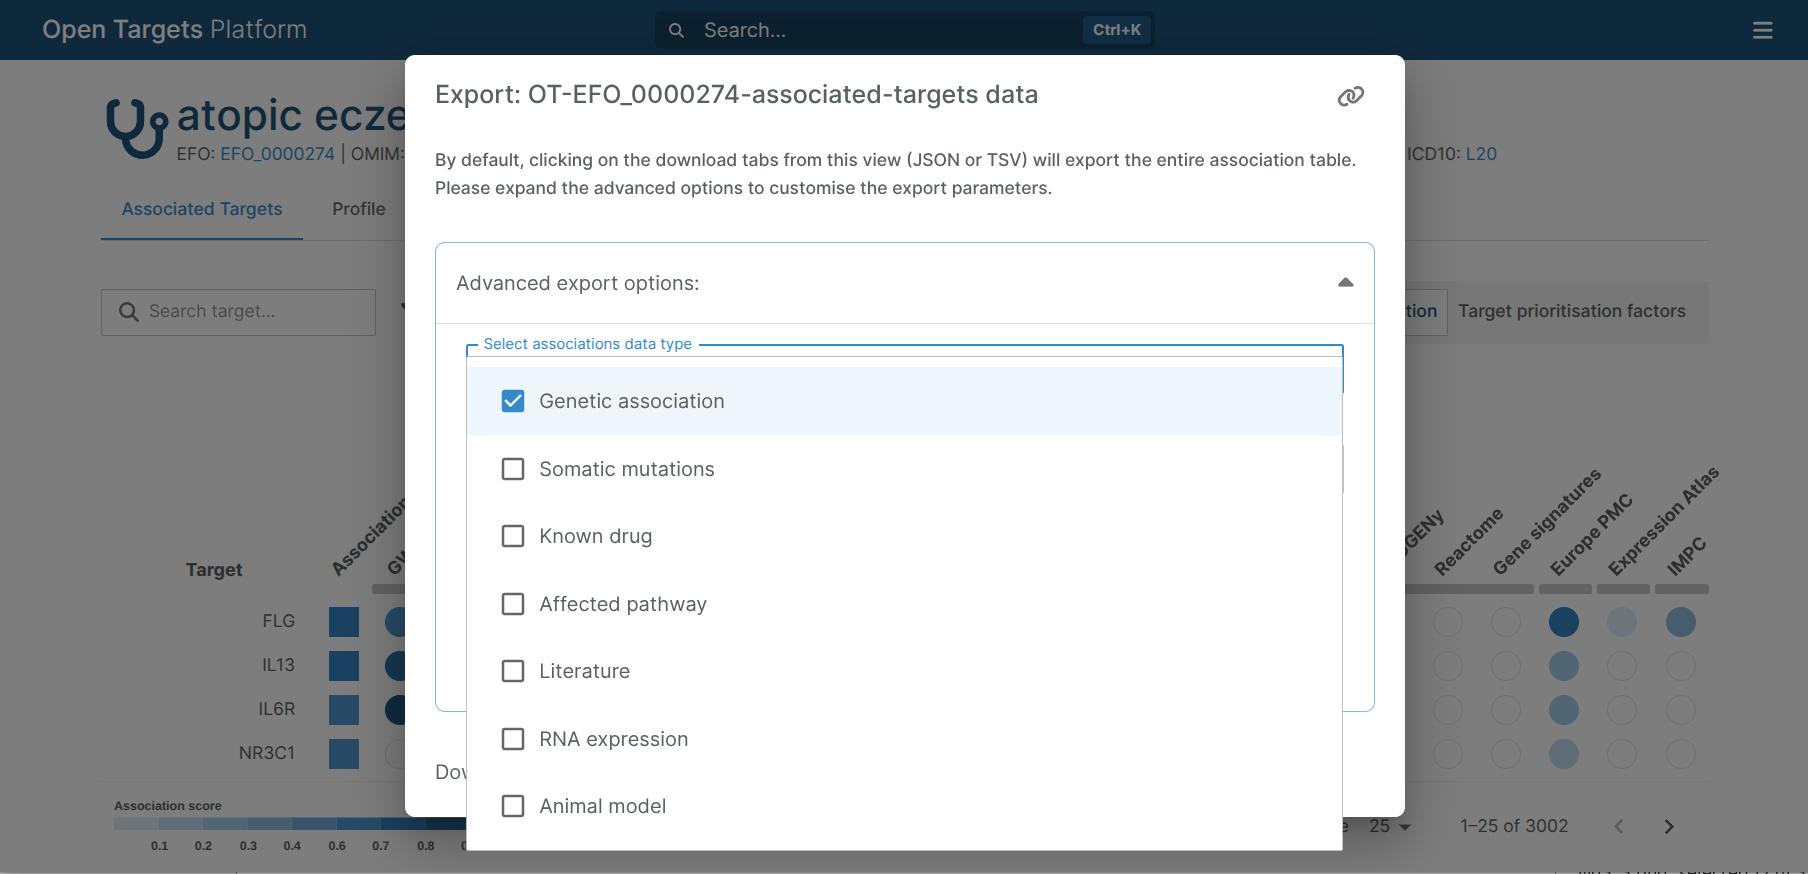
1.6. Finally, click “TSV” to download the file containing the AD-associated genes in a TSV format. Make sure that the option “Include custom controls” is selected.
2. Preparing the data-containing file for integration
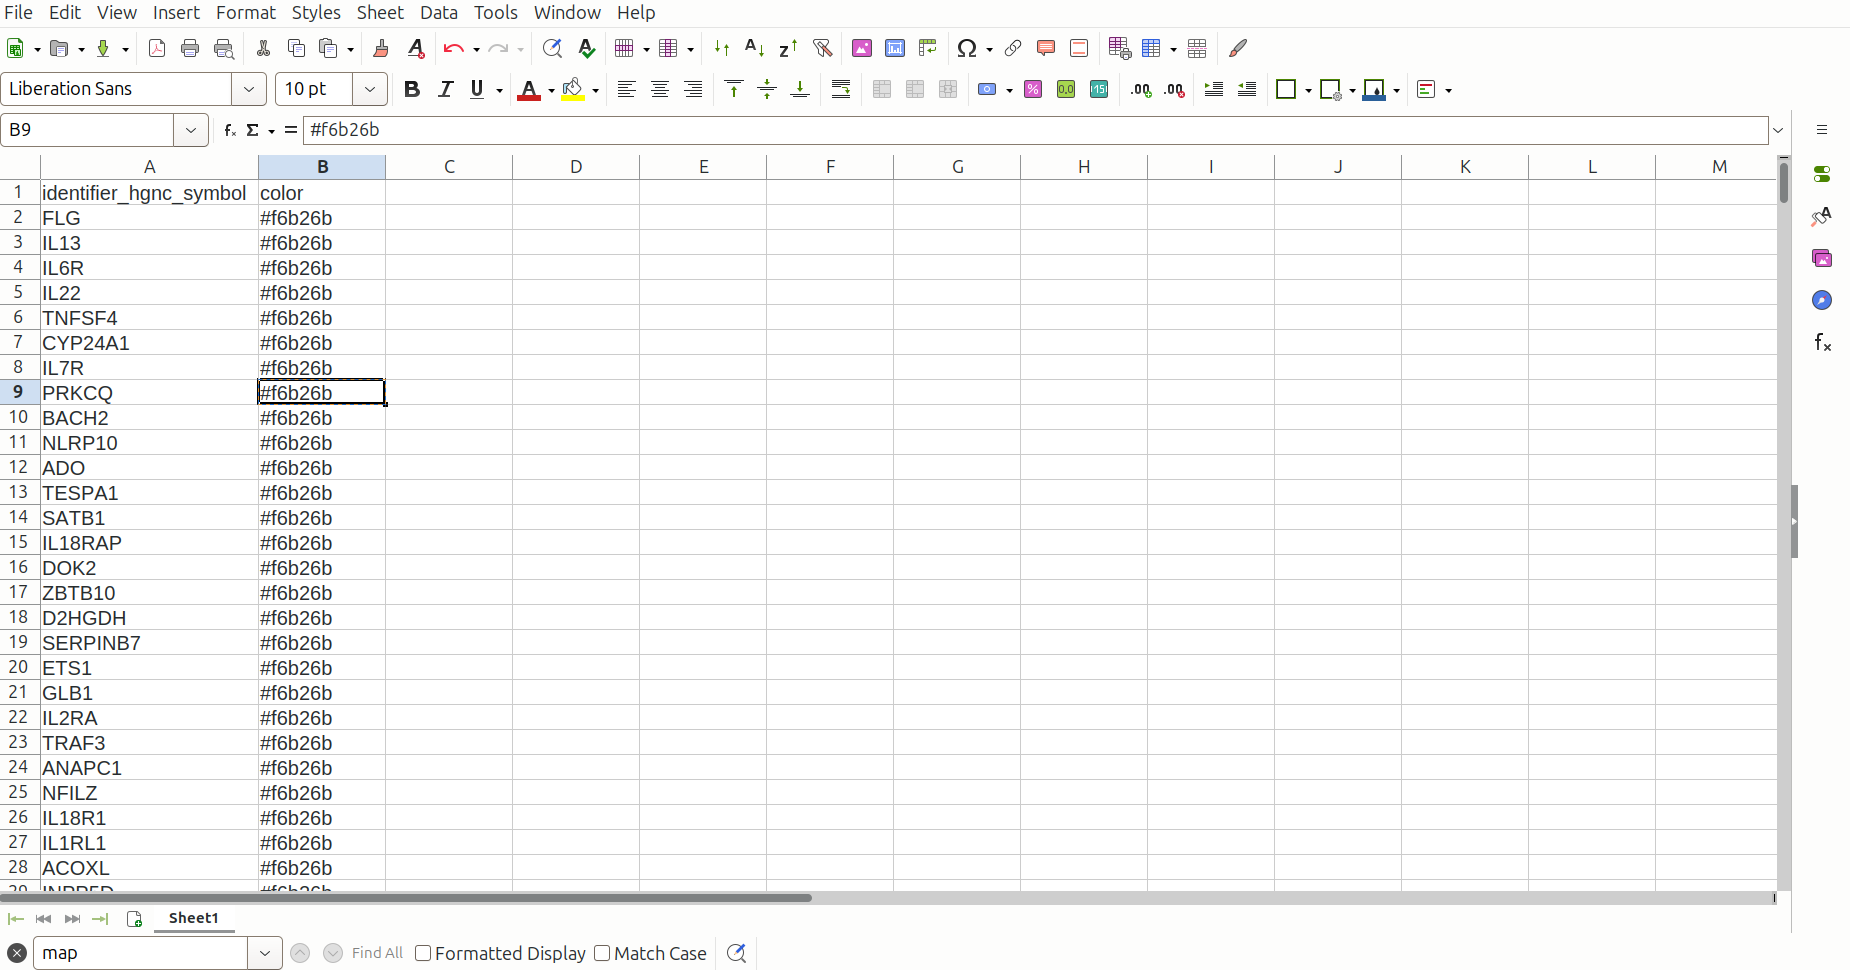
2.1. Open the downloaded TSV file in Excel or similar software. Copy the contents of column 1 (symbol) and paste them into a new spreadsheet.
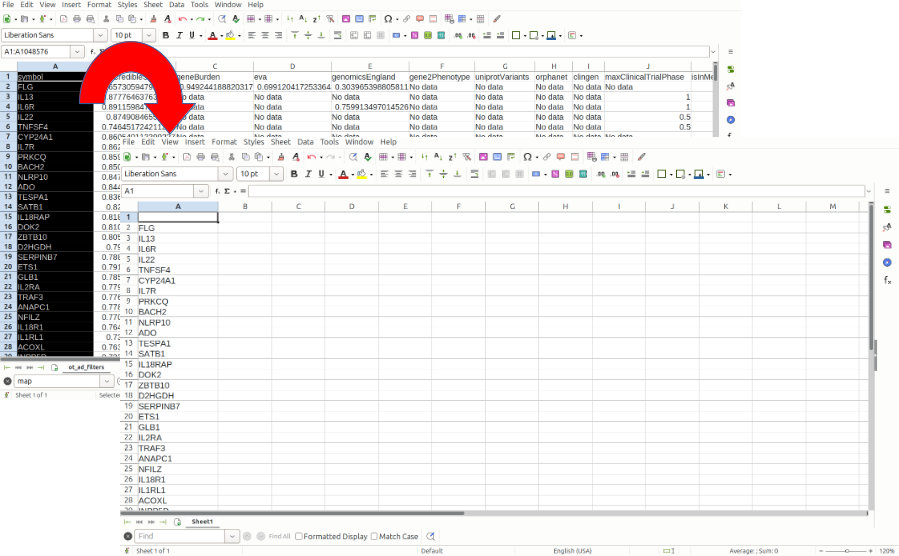
2.2. Create a header: name the column 1 as “identifier_hgnc_symbol” and for column 2 as “color”. The list of genes should start in row 2.
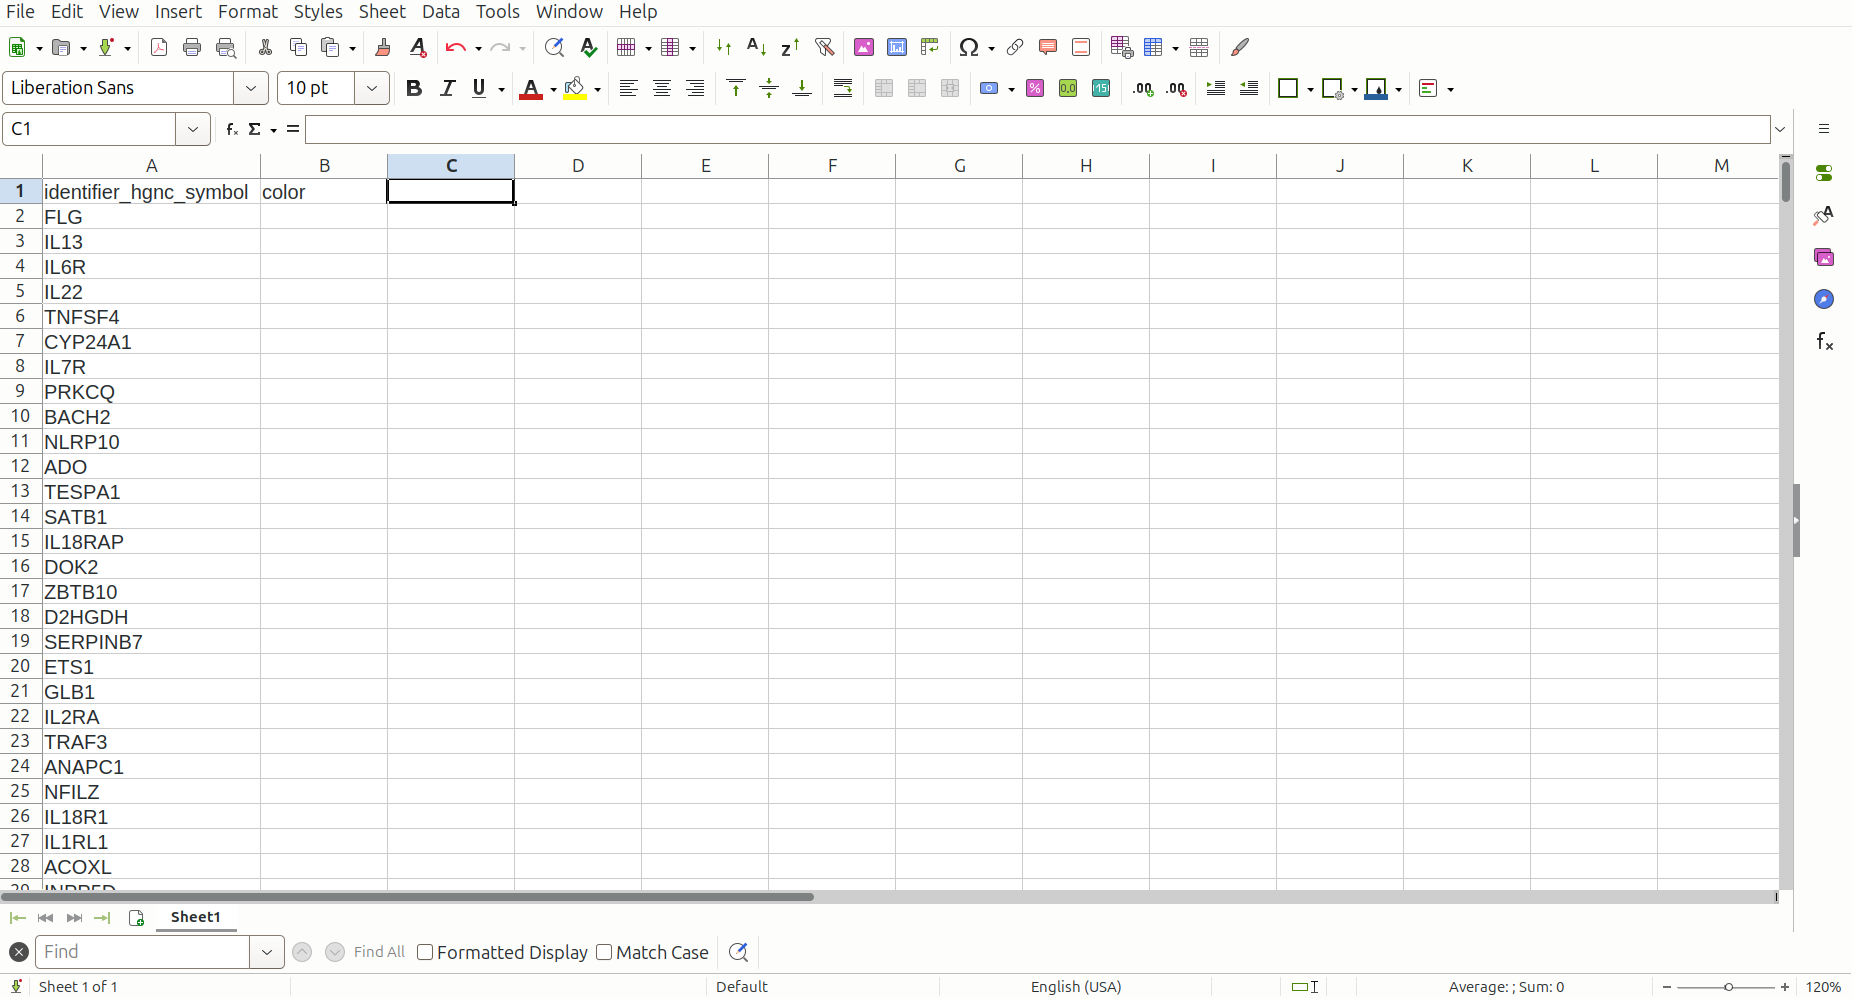
2.3. Fill rows in column “color” with a hex color code for your color of interest. Suggestion: #f6b26b (orange). Save this file as “AD_genetic.txt”
3. Access and log in to the map
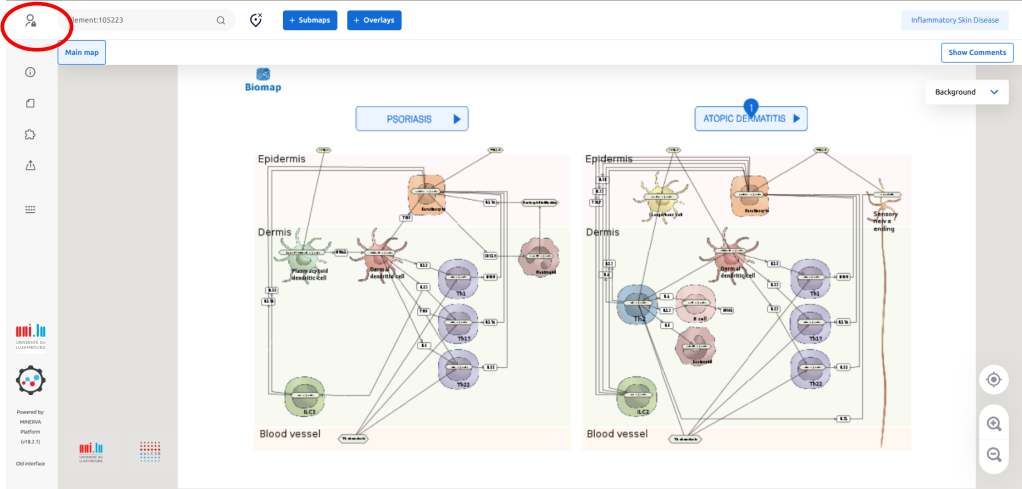
3.1. Access the ISD map at the entry level via the link (https://imi-biomap.elixir-luxembourg.org/). In the (map), click the login icon in the left upper side of the screen. This is required to integrate data into the map.
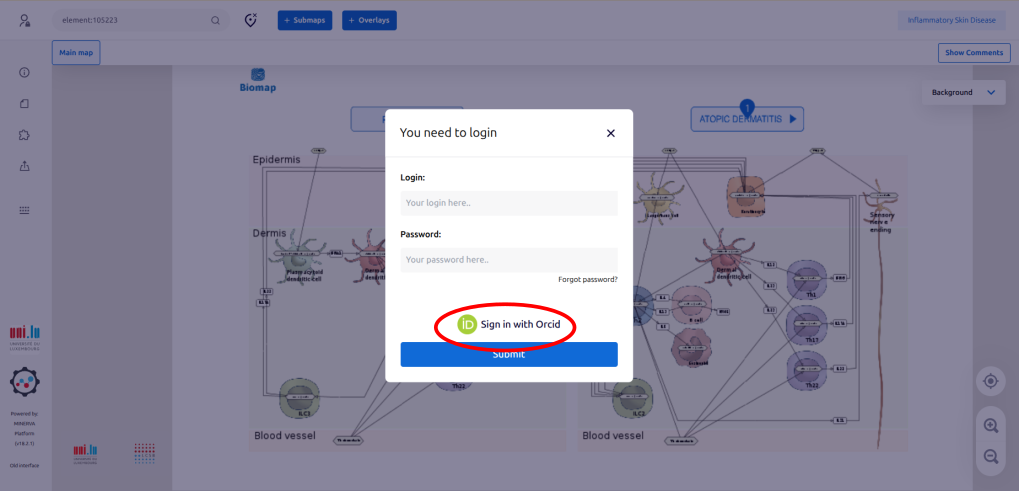
3.2. Log in to the map preferentially by using your ORCID.
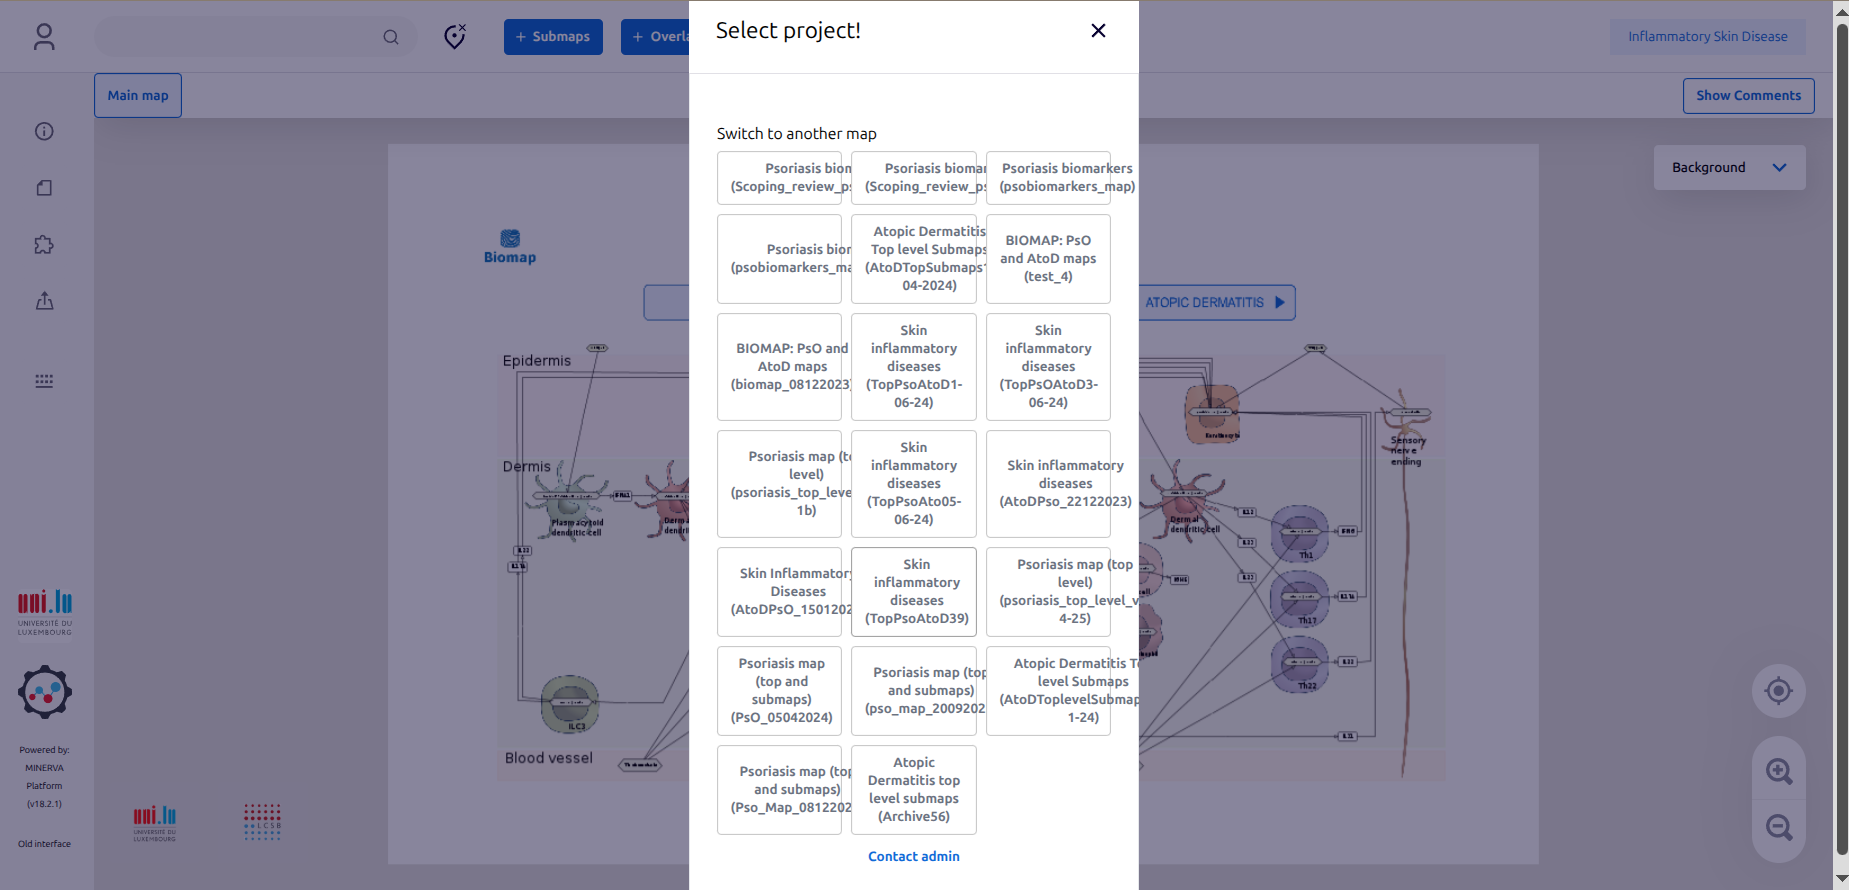
3.3. Once connected, just ignore the window “Select project” by clicking “X”.
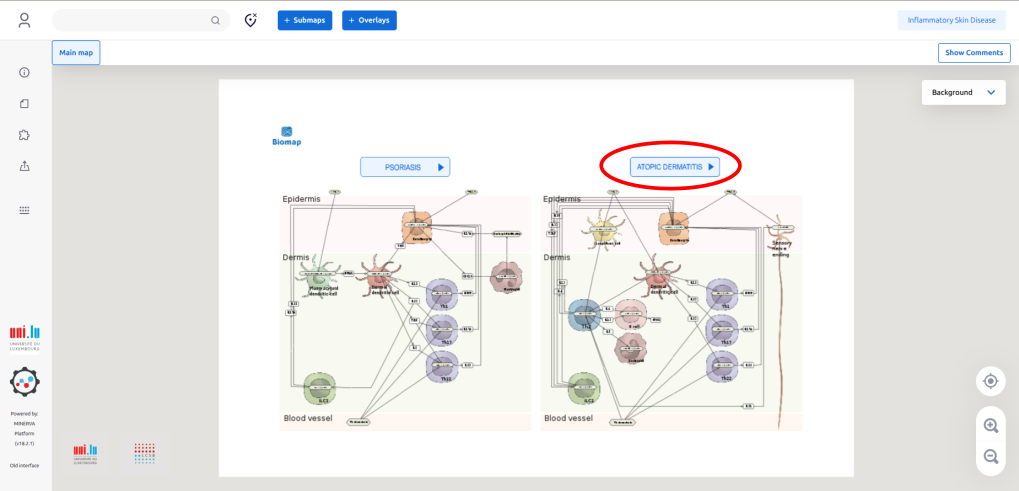
3.4. Click the button “ATOPIC DERMATITIS” to go the AD intercellular communication map
4. Create the overlay for integration
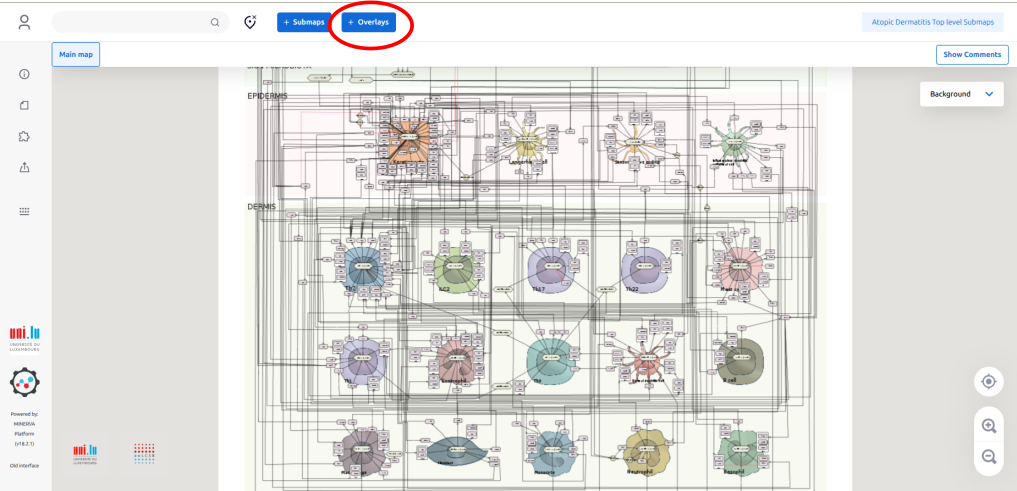
4.1. The integration of data into the map is done via overlay creation. For this purpose, click the button “+ Overlays” above the intercellular communication map
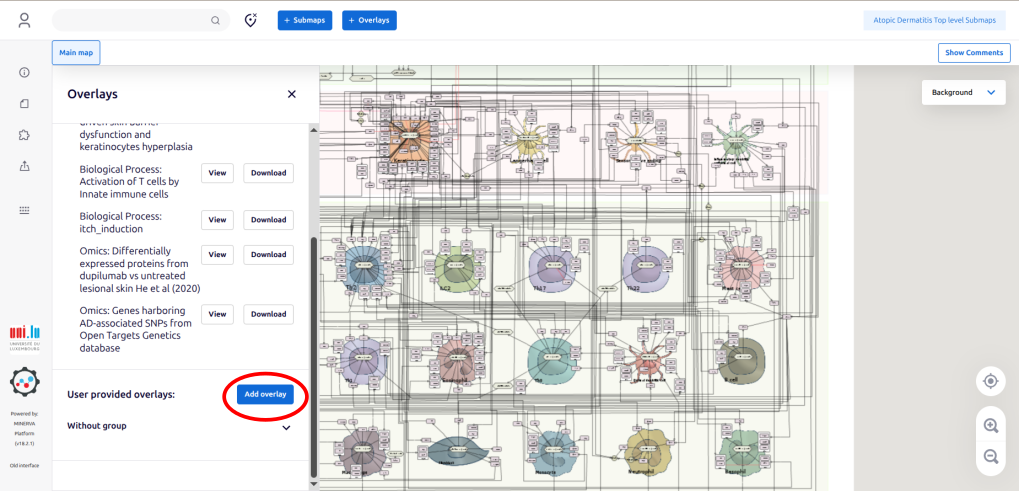
4.2. When the panel “Overlays” opens in the left part of the screen, go straight to the bottom and click “Add overlay”
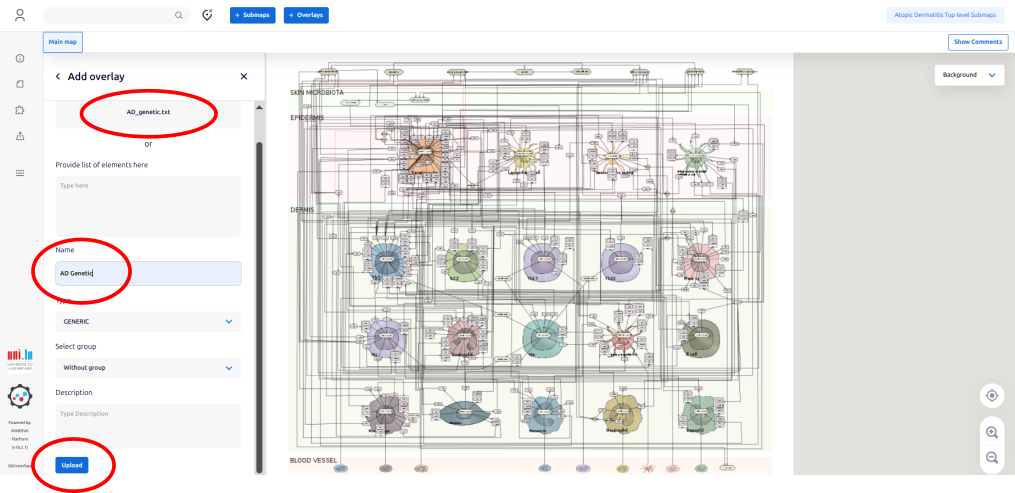
4.3. In the panel “Add overlay”, click “browse” to upload the file “AD_genetic.tsv”.
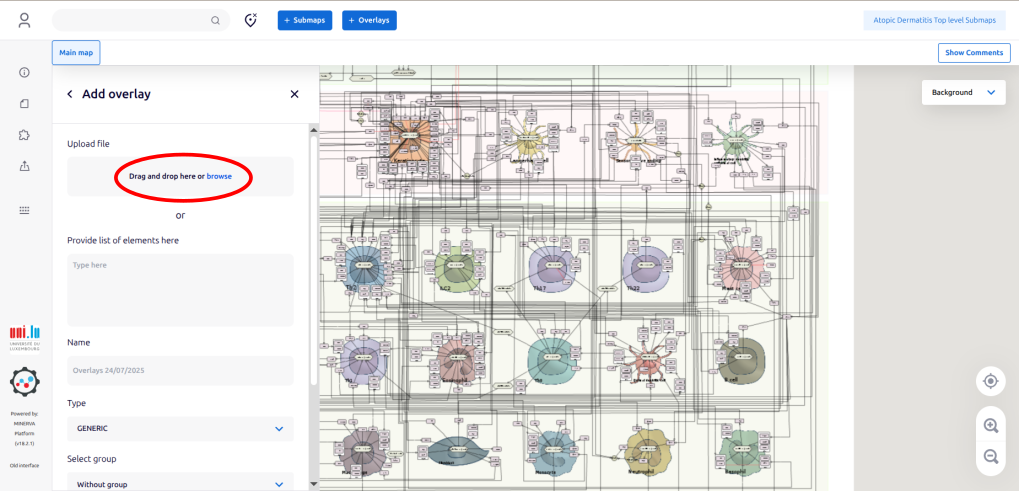
4.4. When you observe “AD_genetic.tsv” instead of “browse”, provide a name in the field “Name” (e.g., “AD genetic”). Go to the botton and click “Upload”
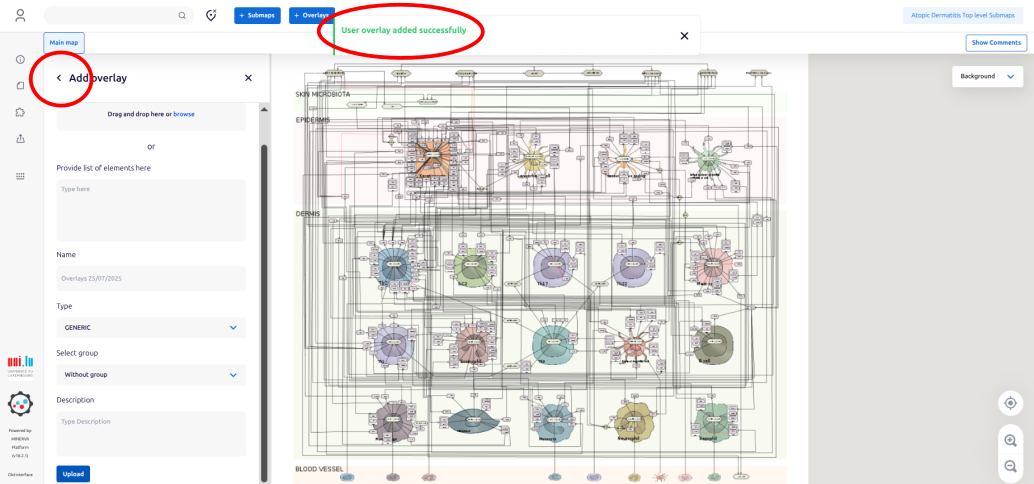
4.5. When you observe the warning “User overlay added successfully”, click “<” close to “Add overlays” to go back to the “Overlay” panel and initiate the explorations as shown in next steps.
5. Integrating and exploring the data into the map
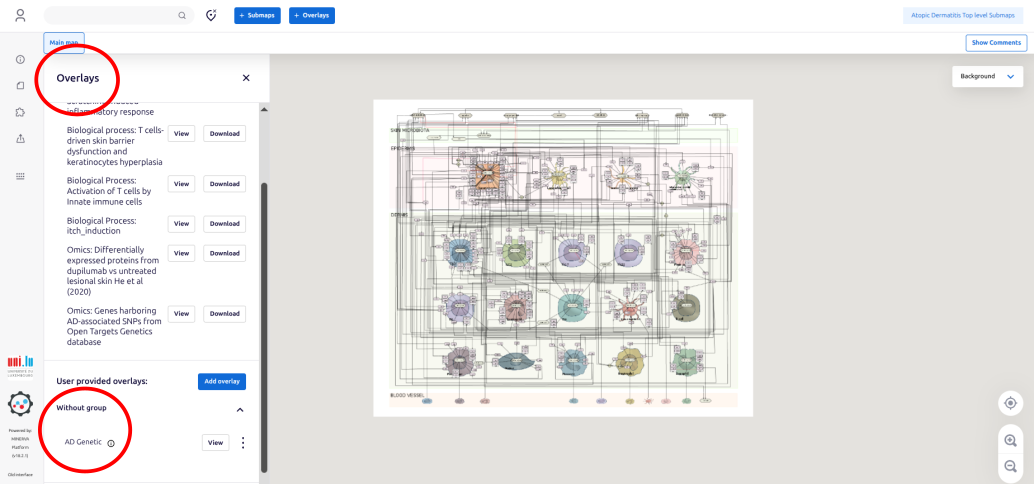
5.1. Access the genetic data, i.e., the overlay “AD genetic”, via the panel “Overlays”. Go to the botton and click “Without group”. The overlay “AD genetic” appears.
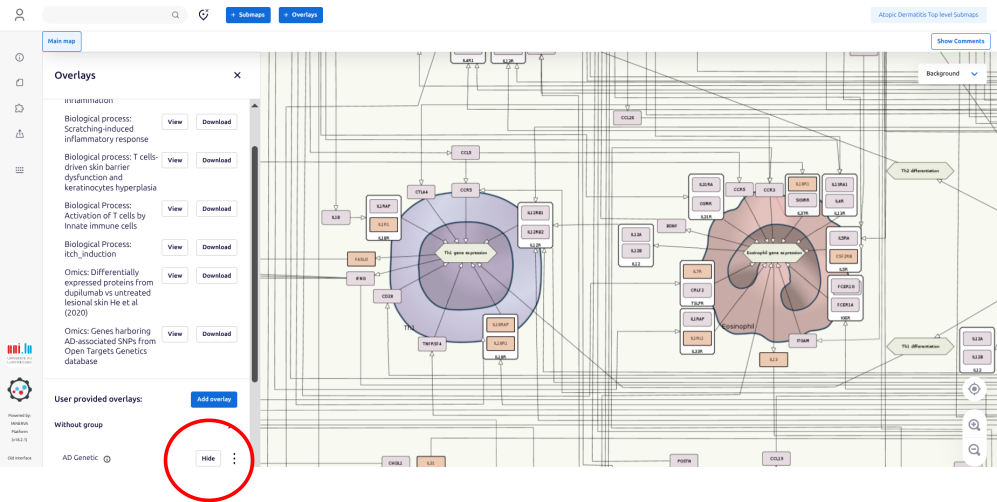
5.2. Click “View” and the proteins matching the genes harboring AD-associated SNPs will be painted in orange (link to the map).
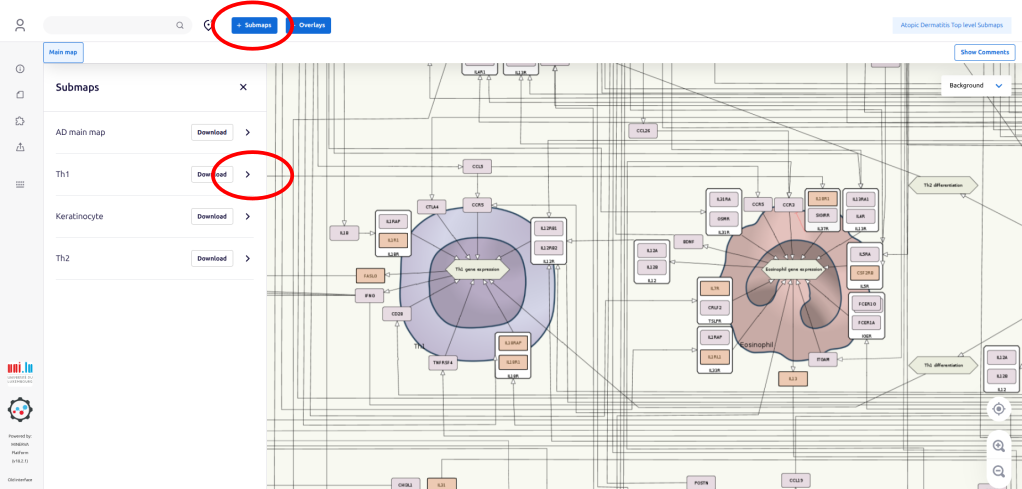
5.3. In this particular application, we want to check the intracellular pathways in Th1 cells. Go to “Submaps” and then click “>” associated with the submap “Th1”
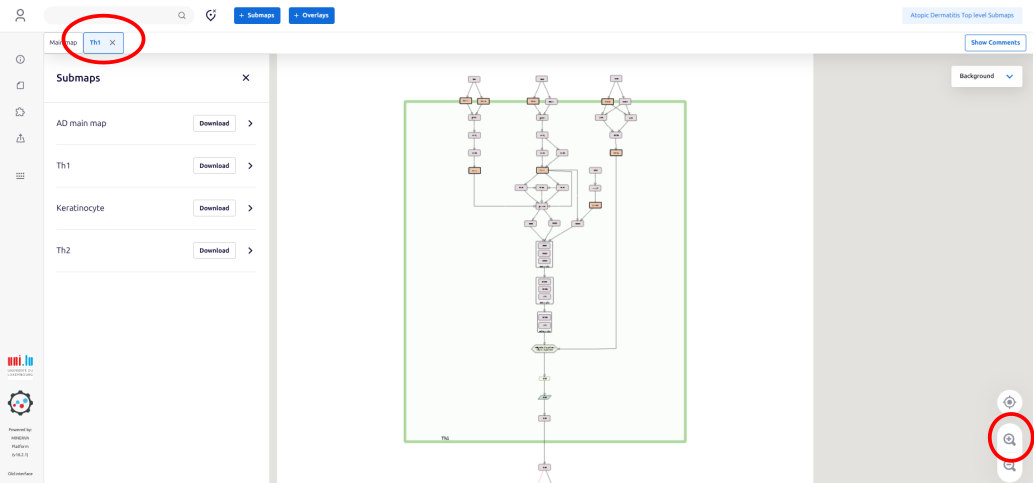
5.4. A new tab (“Th1”) showing the intracellular pathways of Th1 cell appears. It is possible to see some proteins painted in orange. To take a further look at them, click the magnifier icon until the point you are able to read the gene symbols in the elements (link to the map).
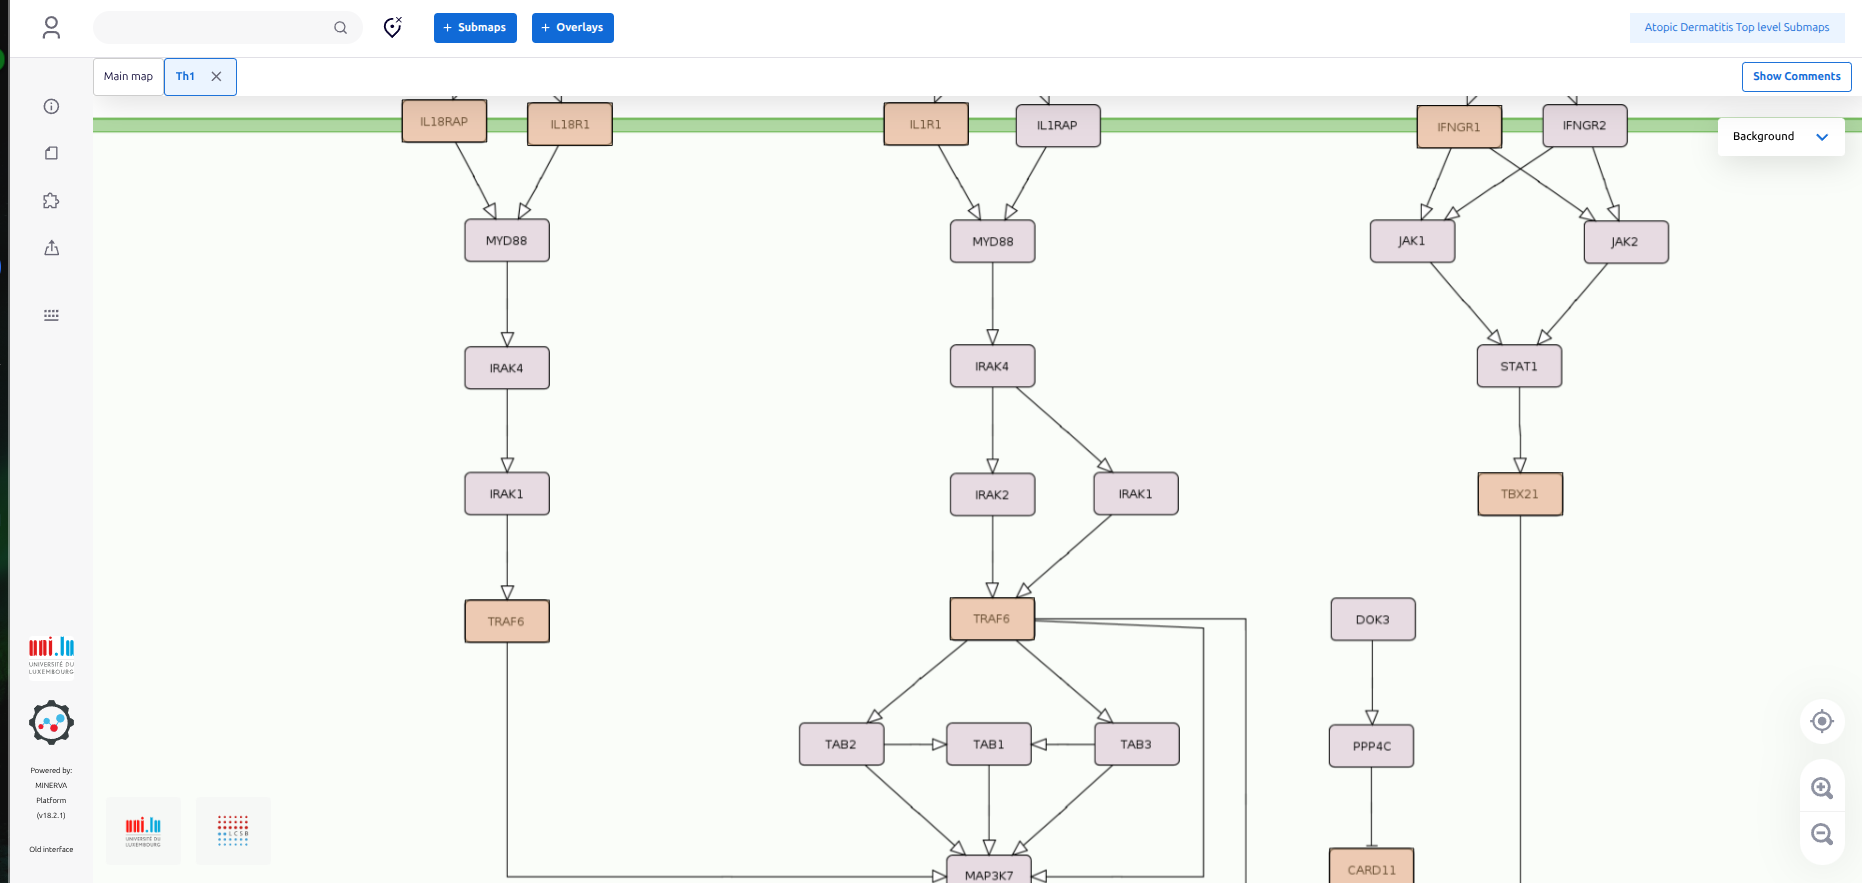
5.5. By navigating the map at the zoom level of your convenience, you can see that there are seven proteins coded by AD-associated genes in the three upstream pathway branches: IL18RAP, IL18R1, IL1R1, IFNGR1, TRAF6, TBX21 and CARD11.
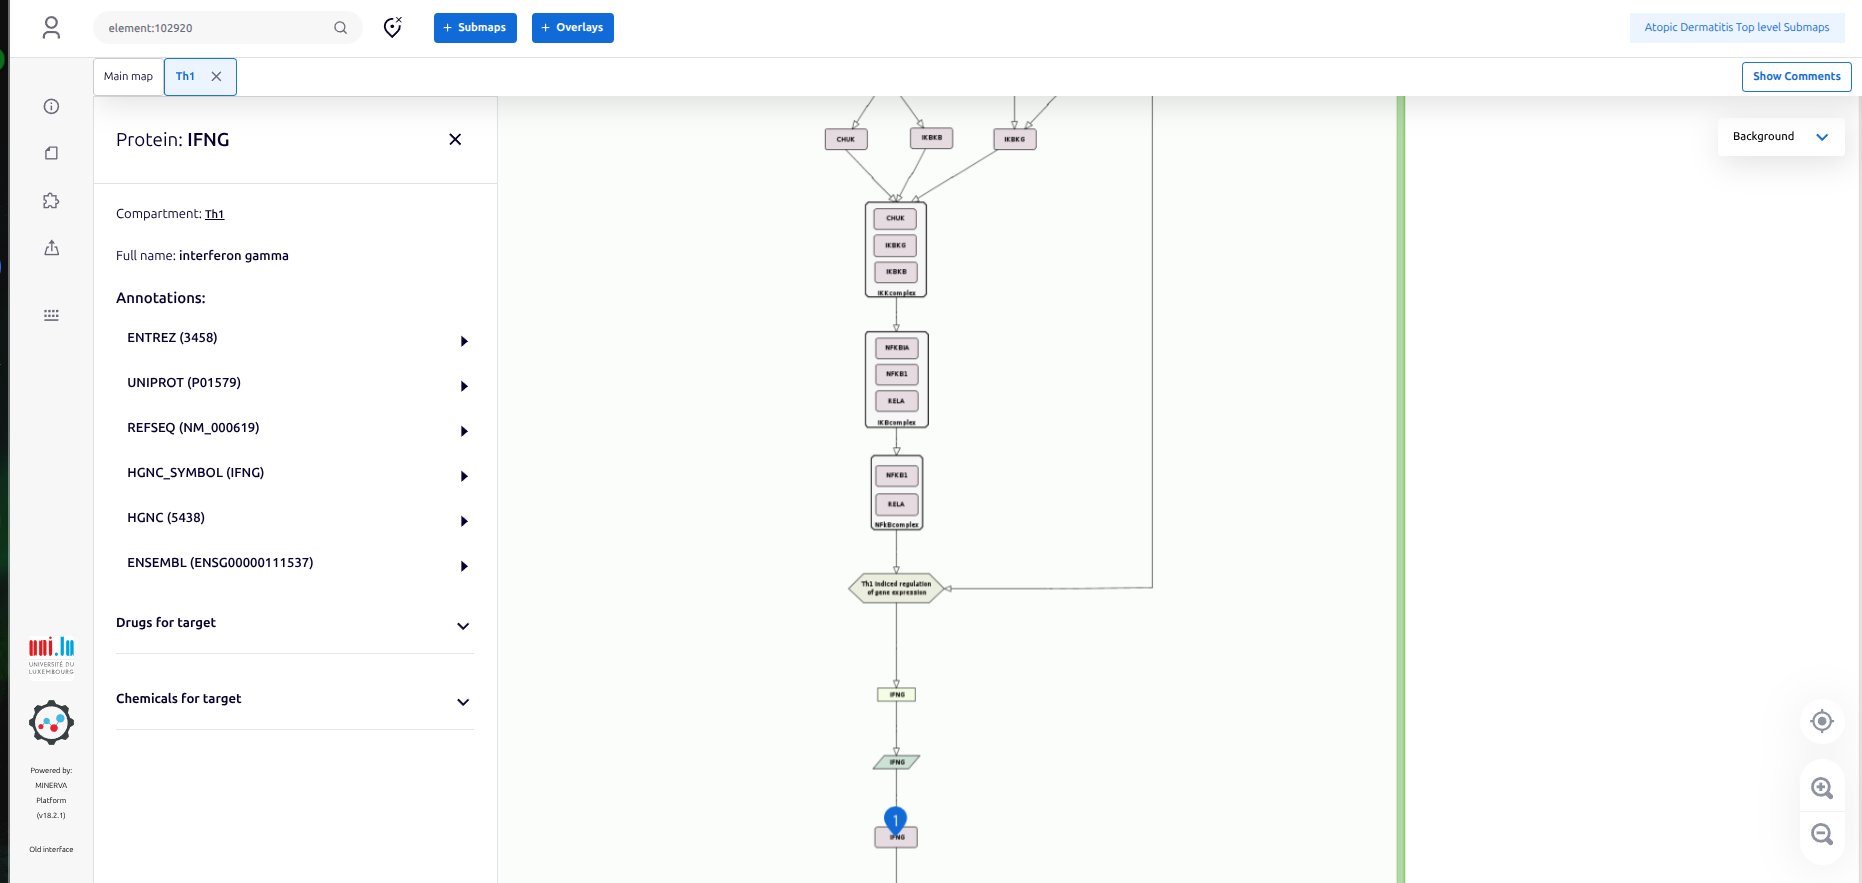
5.6. These three branches converge into one where the target is the expression of IFNG (marked in the map with a blue anchor).
6. Hypothesis
As there are seven proteins potentially altered by AD-associated SNPs upstream to the expression of IFNG in Th1 cells, we can hypothesize that SNPs in upstream IFNG regulators in Th1 cells favor upregulation of IFNG and drive resistance to dupilumab.