MARKOPOLO Disease Maps Course
14 April - 19 May, 10:00 AM every Tuesday and Thursday.
An intensive workshop-style course on the Disease Maps concept and Systems Biology Graphical Notation (SBGN), organised at the Luxembourg Institute of Health (LIH) within the EU-funded MARKOPOLO project.
Course content
Part 1. SBGN diagrams. Learning the SBGN Process Description and Activity Flow languages by redrawing example diagrams in CellDesigner and yEd Graph Editor. Deliverables: diagram files in xml/graphml/newt/sbgnml formats and a table with standard names and IDs for idneitfying diagram entities: ChEBI for metabolites, and HGNC and ChEBI for proteins. Task 1. Glycolysis regulation diagram drawn in CellDesigner/yEd/Newt. Task 2. iNOS diagram in Process Description. Task 3. iNOS diagram in Activity Flow.
Part 2. Disease map architecture. Principles of disease map design: representation at multiple levels of granularity, modularity, interoperability, composability. Disease map development guidelines (https://disease-maps.io/guidelines). The AsthmaMap example (https://asthma-map.github.io).
Part 3. ExposomeMap-PM. Developing specific pathways for extending the ExposomeMap-PM resource. The MINERVA Platform: map upload, automatic annotation for entities, data visualisation. Deliverables: pathway diagrams in CellDesigner and MINERVA, tables with map entities and identifiiers automatically exported from MINERVA, brief textual descriptions with supporting references.
The course follows three stages. First, we cover the basics of standard graphical languages used in systems biology to represent biological networks and conceptual disease models. Second, we discuss principles of disease map architecture, including modularity, interoperability, composability and representation at multiple levels of granularity. Third, we focus on specific pathways for extending the ExposomeMap-PM resource, applying and reinforcing newly learned skills.
Software
CellDesigner, an editor developed by the Systems Biology Institute for building process diagrams and computational models, one of the most widely used tools for this type of diagramming. It has the best compatibility with the MINERVA Platform and is used as the main tool within this course.
yEd Graph Editor, freely available general-purpose graph editor developed by yWorks. A dedicated SBGN palette is available (Siebenhaller et al, 2020). Intuitive for drawing diagrams. Additionally, the experience of drawing in yEd is transferable and can be used for creating any type of diagrams for publications.
Newt Editor, a web-based tool developed for SBGN diagrams (Balci et al, 2021). It has automatic layout algorithms, advanced complexity management, conversion to and from CellDesigner and many other features. No installation required.
Example 1. Glycolysis regulation via bifunctional enzyme
A brief tutorial on drawing the glycolysis regulation diagram in CellDesigner.
This 5-min video demonstrates how to build the glycolysis regulation example diagram in CellDesingner step by step. The original diagram is available at the Metabolism Regulation Atlas.
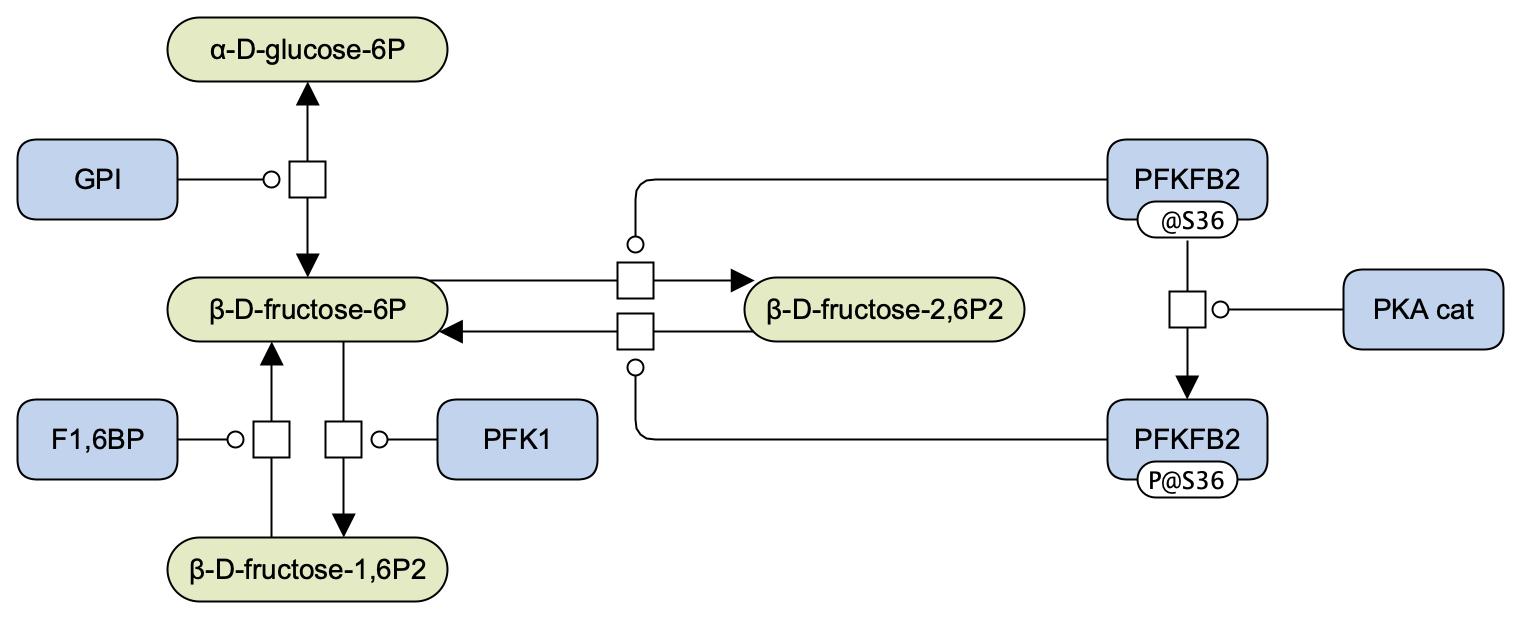
Figure 1. The glycolysis regulation diagram drawn in yEd Graph Editor.
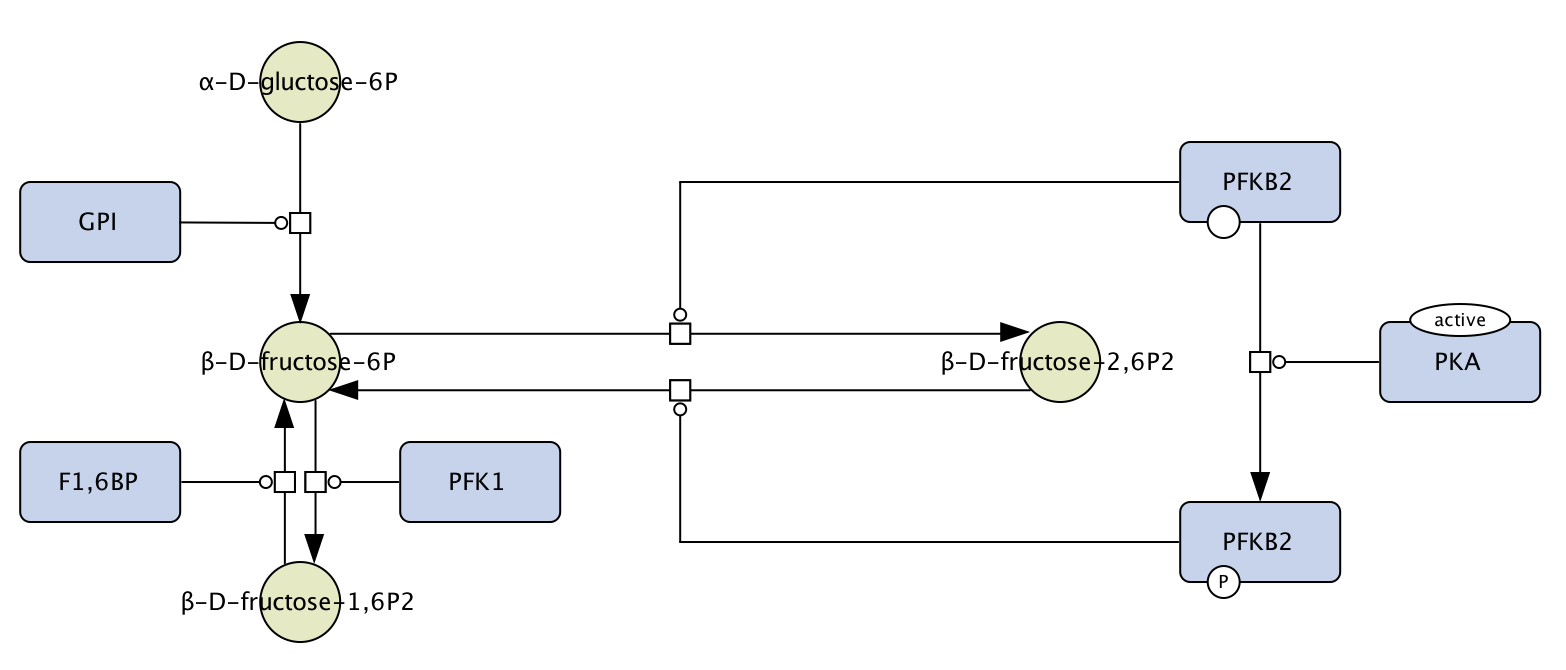
Figure 2. The glycolysis regulation diagram drawn in CellDesigner.
Tips on drawing in CellDesigner
Changing canvas size
Component > Model Information
Saving progress
Sometimes it is possible to introduce errors that make the file unreadable for CellDesigner. It is advisable to close and reopen files to check they are not broken, especially when learning or testing new styles or features. Saving versions of the map regularly helps to avoid situations when the work is lost. Suggested naming system:
mapname_version_optionalcomment.xml
For example:
glycolysis_v001.xml
or
glycolysis_v001_added_ChEBI_annotation.xml
Introducing containers
Square/Oval elements in CellDesigner’s palette (or compartment element in SBGN): better to leave adding them to the final stages of drawing. Otherwise it is harder to move/copy-paste map elements.
Also see Drawing SBGN PD in CellDesigner.
Example 2. iNOS pathway
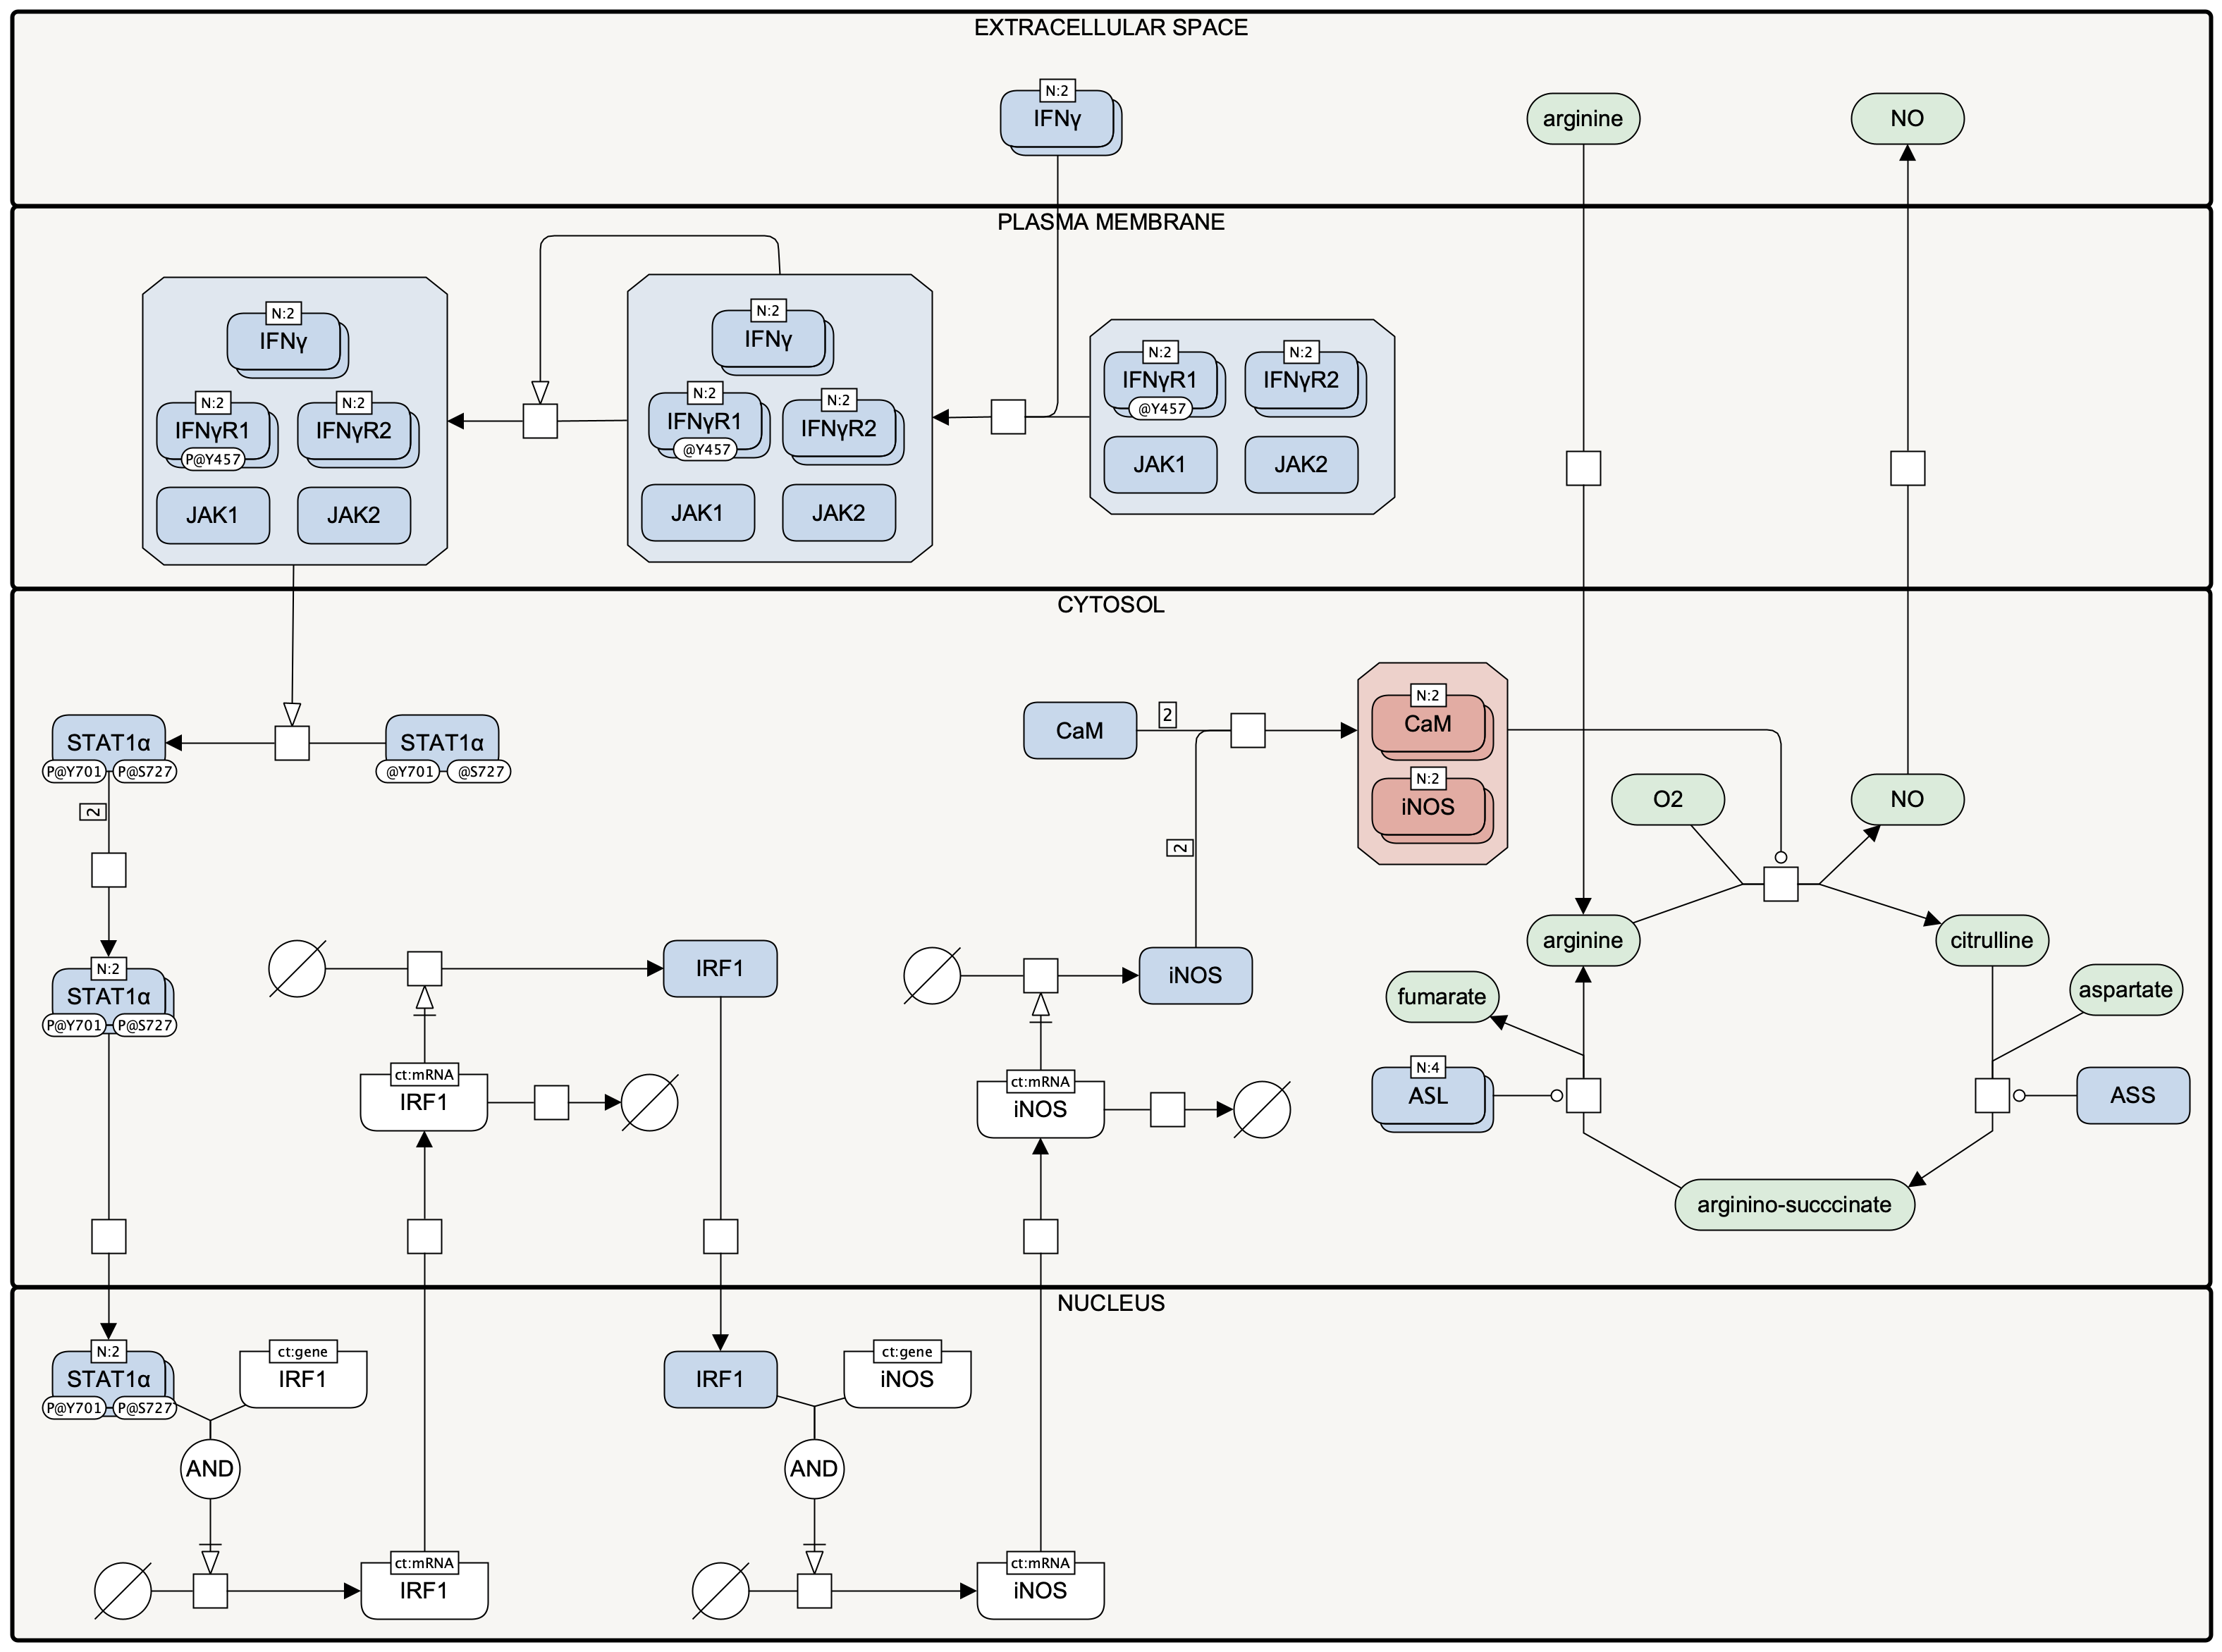
Figure 3. The iNOS pathway drawn in yEd Graph Editor.
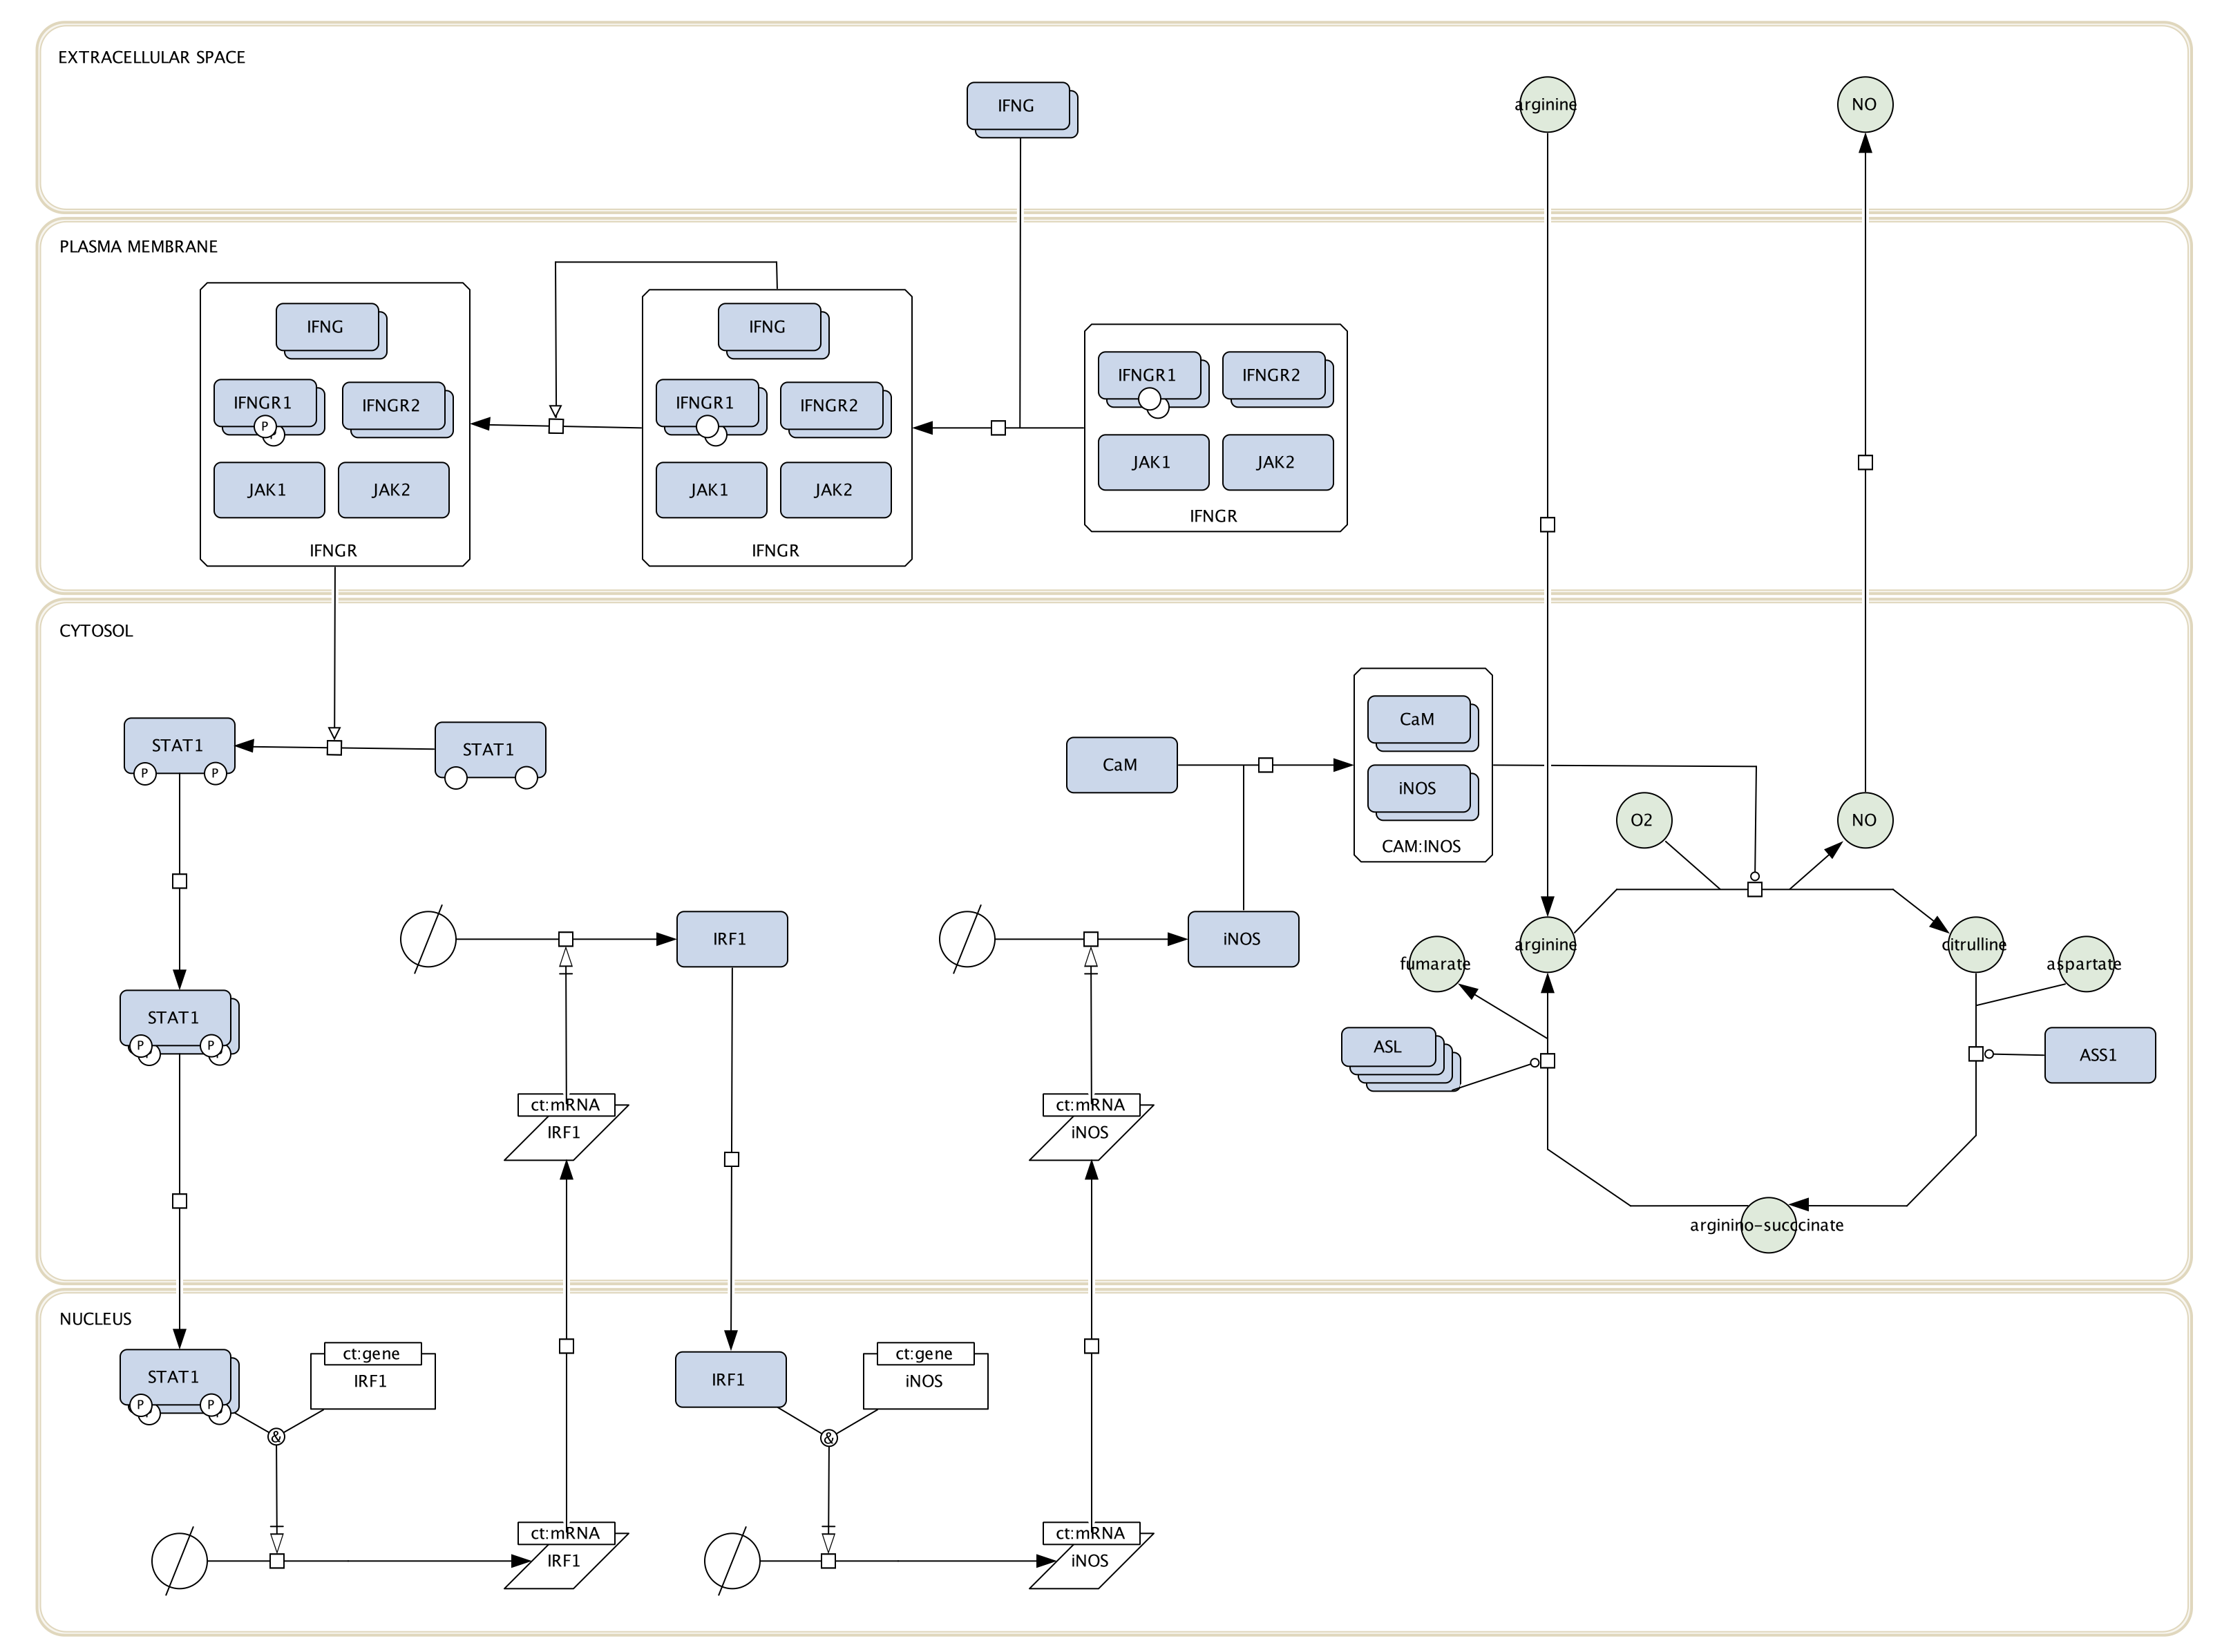
Figure 4. The iNOS pathway drawn in CellDesigner.
Activity Flow vs. Process Description
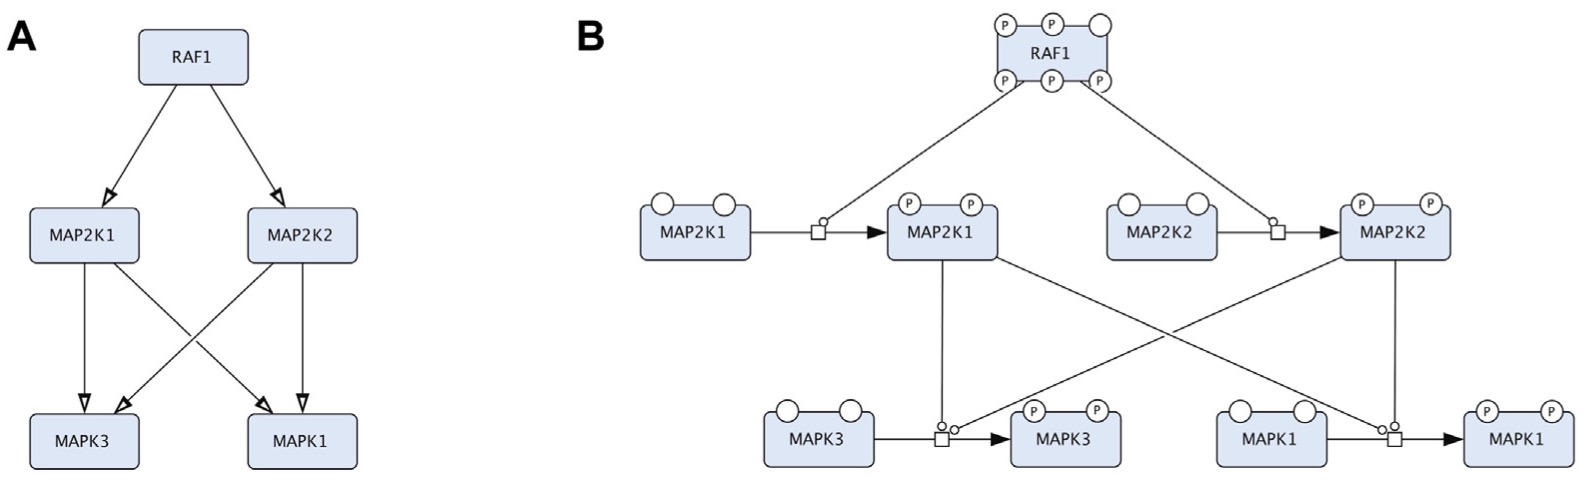
Figure 5. An example that compares two representations in CellDesigner that correspond to Activity Flow (Reduced Notation palette in CellDesigner) and Process Description (default palette in CellDesigner). The two diagrams represent the same biological events but in two conceptually different languages. A. The Activity Flow representation of the RAF-MEK-ERK signalling: the activity of RAF1 stimulates the activity of MEK1/2 (MAP2K1 and MAP2K2 in official HGNC names), and the activity of MEK1/2 stimulates the activity of ERK1/2 (MAPK3 and MAPK1 in official HGNC names). B. The Process Description representation of the RAF-MEK-ERK signalling: the process of MEK1/2 phosphorylation is catalysed by RAF1 and the process of ERK1/2 phosphorylation is catalysed by the phosphorylated MEK1/2 (Mazein et al, 2023).
Resources
Systems Biology Graphical Notation
SBGN learning
Learner’s reference cards
Drawing SBGN PD in CellDesigner
SBGN PD specification
Reusable patterns and examples
SBGN Bricks
SBGN Bricks paper (2021)
Metabolism Regulation Atlas
Disease map construction